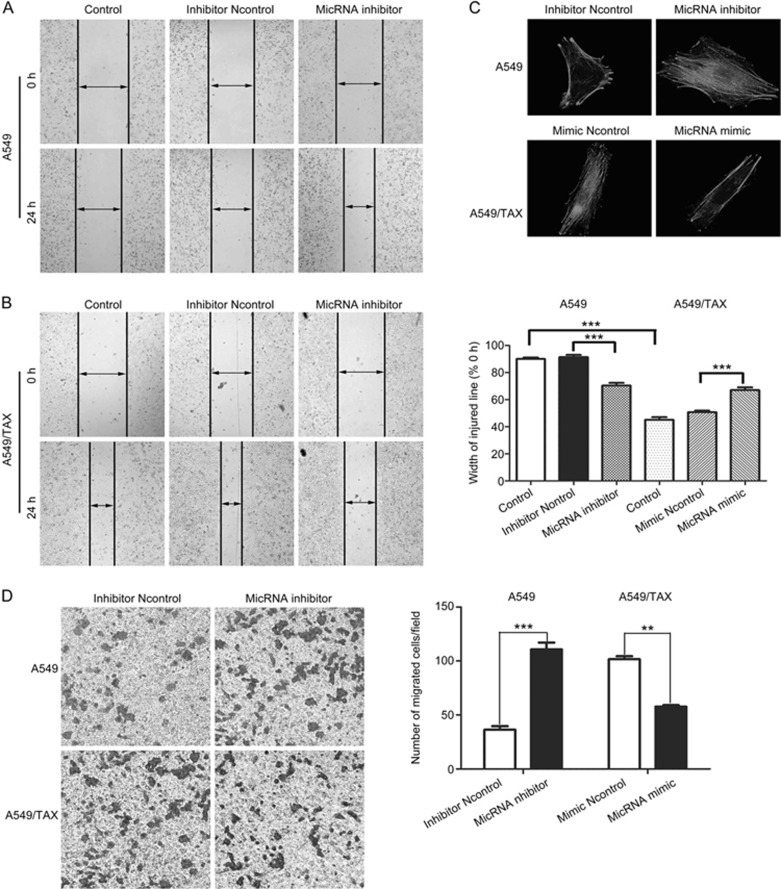
Figure 4.
miRNA-200c suppressed cell invasion and migration in A549 and A549/TAX cells. (A and B) The ability of cell migration was evaluated by wound-healing assay. Images were captured using a 4×objective lens. (C) The ability of cell invasion was evaluated by transwell assay. Images were captured using a 10× objective lens. (D) Representative phalloidin staining for actin-cytoskeleton in A549 transfected with miRNA-200c inhibitor or negative control and A549/TAX cells transfected with miRNA-200c mimic or negative control. Spreading of cells was analyzed after plating on collagen-coated slides. Cells were fixed, stained with phalloidin, and visualized at indicated time points by fluorescent microscopy. Images were captured using a 63× objective lens. At least three independent experiments were performed. *P<0.05, **P<0.01, and ***P<0.001 compared with control group.

