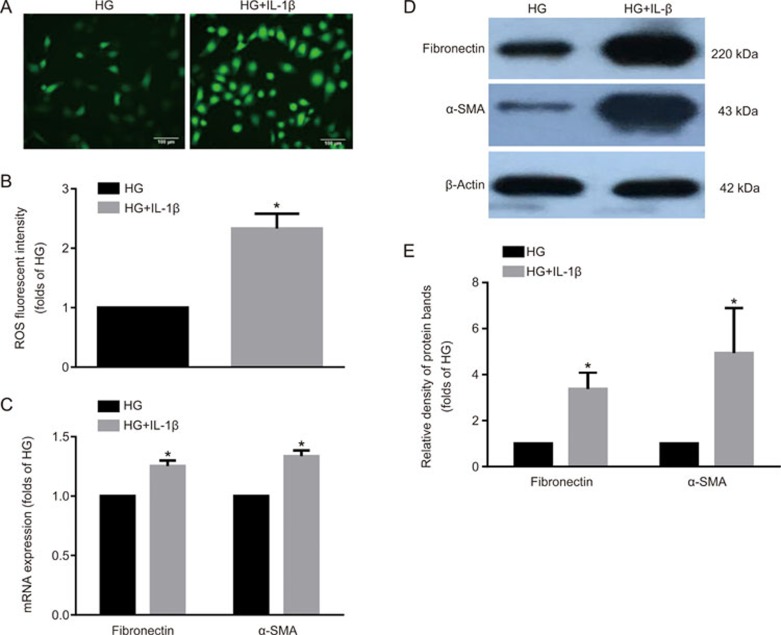
Figure 3.
Inflammation-induced lipid accumulation increased ROS production and extracellular matrix (ECM) excretion in HK-2 cells. HK-2 cells were made quiescent using serum-free medium for 24 h and treated with 30 mmol/L glucose (HG) or 30 mmol/L glucose plus 5 ng/mL IL-1β. ROS staining was performed using DCFH-DA (A, original magnification ×200). The fluorescence intensity of ROS was calculated using Image J software (B). Real-time PCR (C) and Western blot were used to evaluate the expressions of fibronectin and α-SMA (D and E). The histogram represents the mean±SD of the densitometric scans of the protein bands per group, normalized by comparison with β-actin. *P<0.05 vs HG group.

