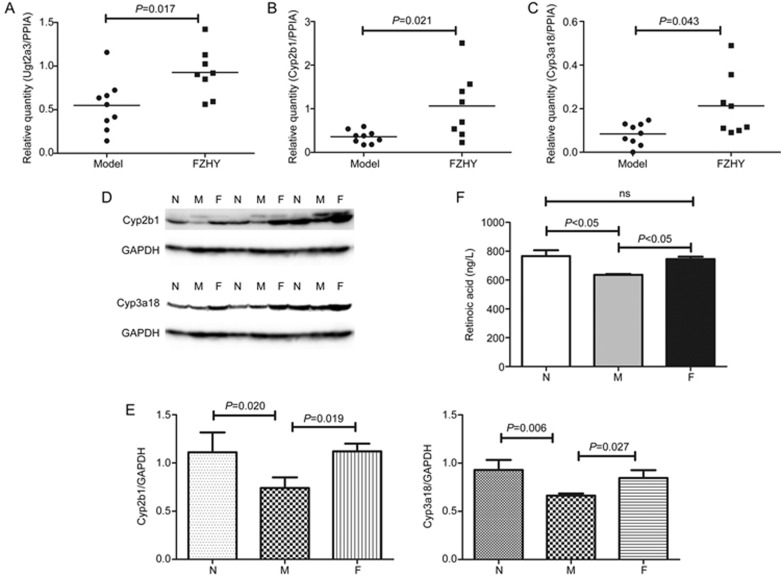
Figure 8.
Expression levels of Ugt2a3, Cyp2b1, and Cyp3a18 by qRT-PCR and Western blot and the concentration of retinoic acid. Ugt2a3, Cyp2b1, Cyp3a18 and retinoic acid were all elevated in the FZHY-treated group compared to the model group. (A-C) qRT-PCR. (D) Western blot. (E) A quantity analysis was performed to demonstrate relative quantities in liver tissues. Mean±SD, n=8 or 9 in qRT-PCR; n=3 in Western blot. (F) Concentration of retinoic acid. The data are shown as mean±SEM, n=5.

