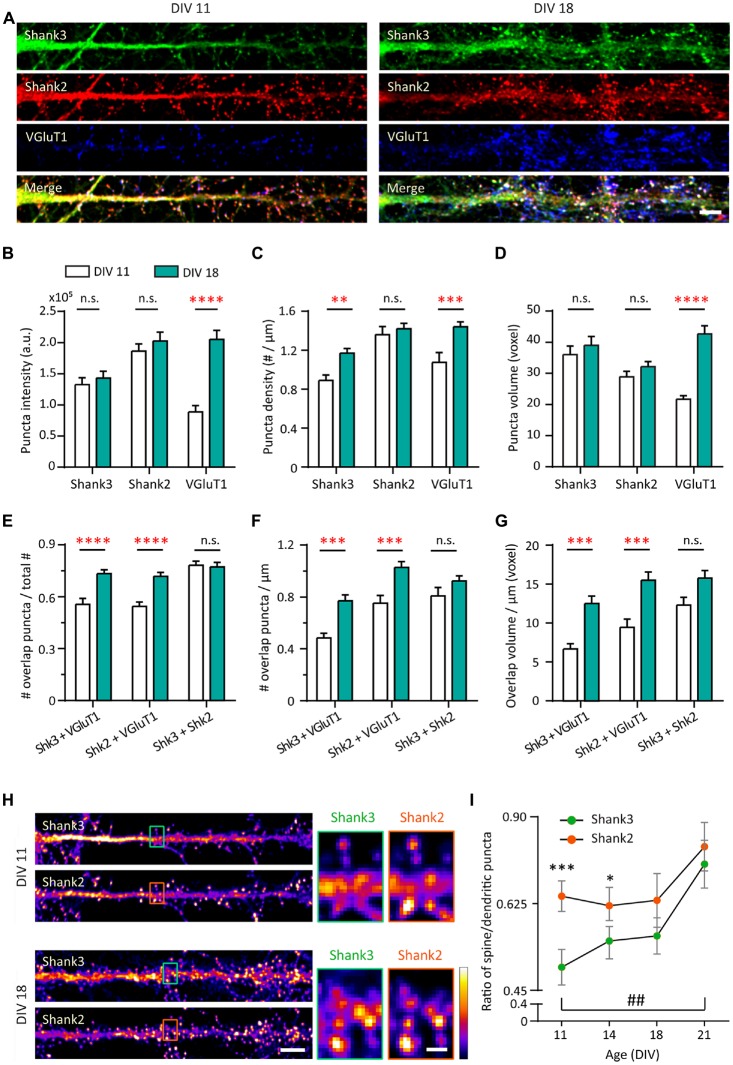
Figure 1.
Increase in synaptic expression of Shank2, Shank3 and VGluT1 during development. (A) Straightened dendrites of young (days in vitro 11, DIV 11) and mature (DIV 18) hippocampal neurons co-immunostained for Shank3 (A488, green), Shank2 (A568, red) and VGluT1 (A647, blue). White puncta in the merge images (bottom) indicate colocalization of all three proteins. Scale bar: 5 μm. (B–D) Three-dimensional analysis (IMFLAN3D) of Shank3 and Shank2 puncta at DIV 11 and 18 quantifying intensity (B), density (C) or volume (D) (mean ± SEM). (E–G) Three-dimensional colocalization analysis of pairwise puncta overlap as measured by the ratio (E), density (F) and volume (G) at DIV 11 and 18 [mean ± SEM; N = 16 dendrites from 10 to 12 neurons from two culture preparations (referred to as culture preps from now on; Mann-Whitney tests. n.s. p ≥ 0.05, **p < 0.005, ***p < 0.0005, ****p < 0.0001)]. (H) Straightened dendrites of young and mature hippocampal neurons immunostained for Shank3 and Shank2. Scale bar: Image, 5 μm; Corresponding inset, 1 μm. (I) Summary graphs showing quantification of Shank3 and Shank2 relative enrichment in spines vs. in dendritic puncta (DIV 21, N = 18; all others, N = 16 dendrites from 10 to 12 neurons from two cultures preps; Kruskal-Wallis one-way analysis of variance (ANOVA) followed by Dunn’s correction post hoc multiple comparisons. Comparing between Shank2 and Shank3 at the same age: *p < 0.05; ***p < 0.0005. Comparing Shank3 between different ages: ##p < 0.005).

