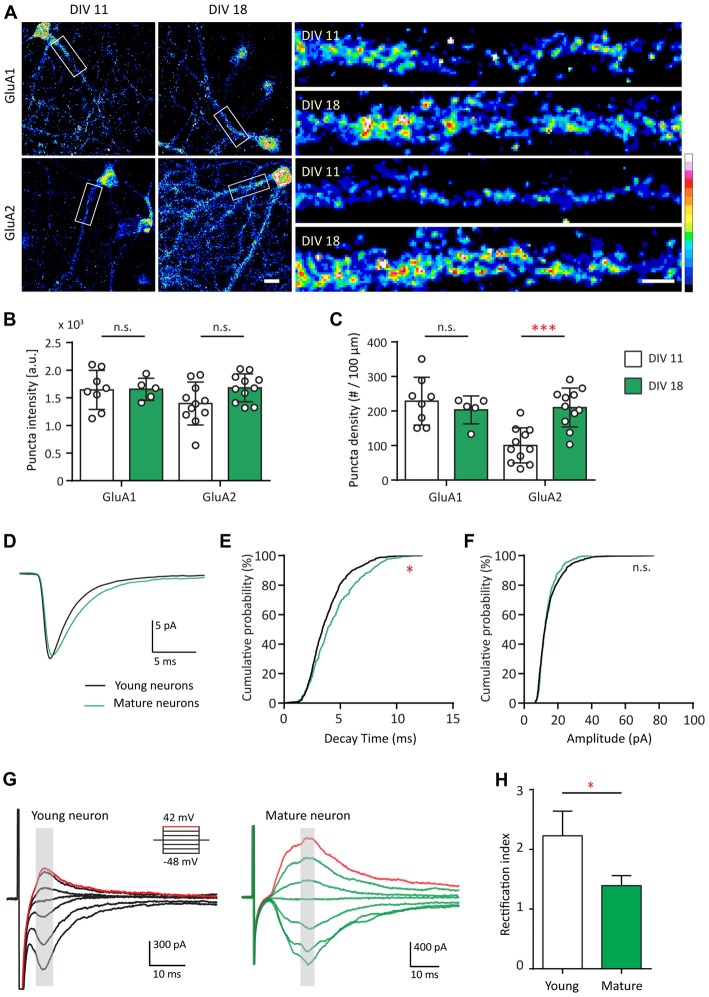
Figure 2.
AMPA receptor (AMPAR) subunit composition and functional change during development. (A) Hippocampal neurons were fixed and immunostained for GluA1 (top) or GluA2 (bottom) at DIV 11 and DIV 18. White boxes indicate the straightened dendrites (right). Scale bar: image, 15 μm; dendrite, 5 μm. (B,C) Summary graphs showing quantification of GluA1 and GluA2 puncta intensity (arbitrary fluorescent units—a.u.) (B) and density (puncta per 100 μm; C) [mean ± SEM; DIV 11, N = 8; DIV 18, N = 5 dendrites for GluA1; N = 11 for GluA2 from 5 to 10 neurons from two culture preps; Mann-Whitney test. n.s. p ≥ 0.05, ***p < 0.001]. (D) Ensemble-averaged miniature EPSCs (mEPSCs) from all events recorded in young (black) or mature (green) neurons [N = 11 (young) and 10 (mature) neurons from 4 to 7 culture preps, which applies to all subsequent panels unless otherwise specified]. (E,F) Cumulative probability histograms of decay time (E) or amplitude (F) from all isolated events of young or mature neurons [Kolmogorov–Smirnov (K.S.) test, N = 600 events (young) and 400 events (for mature), n.s. p ≥ 0.005, *p < 0.005]. (G) AMPAR-mediated EPSCs (averaged from three trials) evoked at various holding potentials (see diagram, upper right) from a young (black, left) or mature (green, right) hippocampal neuron. Red traces correspond to the current response at the most positive holding potential. Gray shaded bars used for calculating peak current amplitude. (H) Summary graph showing the difference of AMPAR inward rectification property between young and mature neurons [mean ± SEM; N = 29 cells (young) and 13 cells (mature) from 3 to 5 culture preps. Mann-Whitney test, *p < 0.05].

