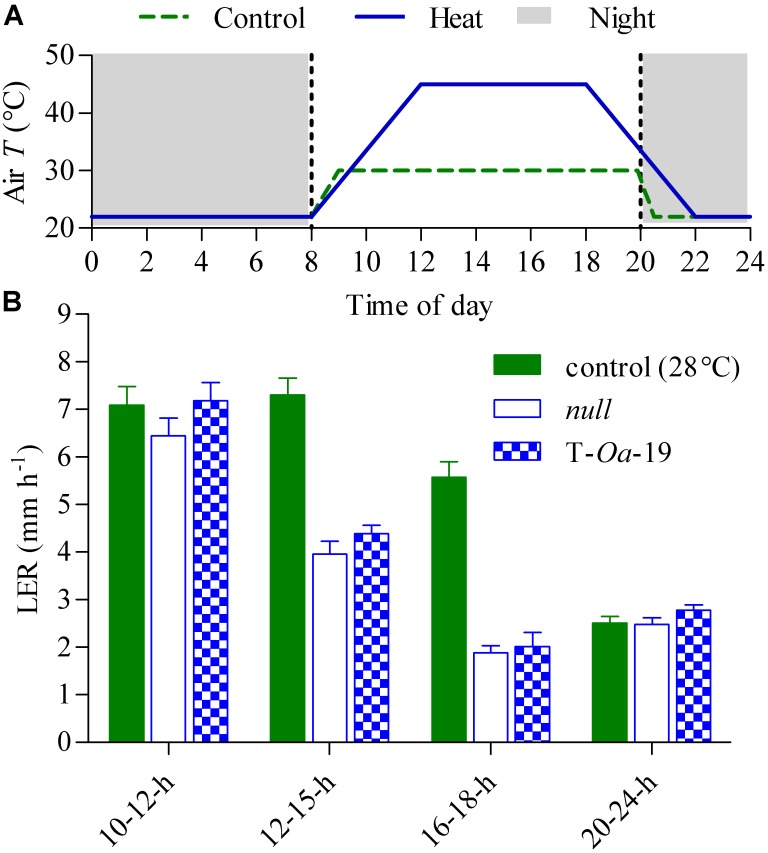
FIGURE 2.
Leaf elongation rates (LER) of null and T-Oa-19 plants grown at constant (28°C) daytime temperatures or a six-hourly 45°C heat treatment. Data were collected from plants grown at 28°C immediately prior to imposing the heat treatment. (A) Representation of the 24-h diurnal cycle applied from 4 weeks after sowing until the onset of anthesis. The control (dashed green line) and 45°C treatment (solid blue line) show the changes in air temperature over the day/night cycle, with the night represented by grey shading. (B) LER are shown at four times in the diurnal cycle. Rates were identical for both genotypes at 28°C at every measurement interval (see green filled bars). LERs are shown alongside for the two genotypes grown at 45°C daily maximum, with open blue bars representing the null control and T-Oa-19 the most strongly expressed transgenic line (hatched bars), as seen in Figure 1. The period over which LER was measured appears on the x-axis of panel (B). Values are the mean and SEM of 5–10 biological replicates. Analysis by ANOVA shows LER declined significantly over the diurnal cycle (F = 132, p < 0.001), and there was a significant difference in LER between the null and T-Oa-19 lines (F = 4.4, p = 0.0045) over the entire diurnal period.

