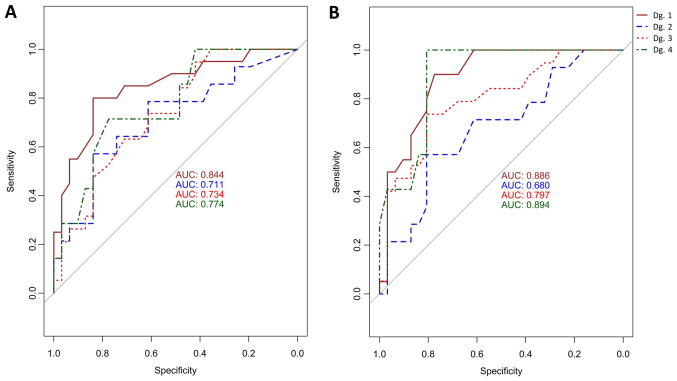
Figure 5.
(A) ROC curve with AUC values (logistic regression) for samples from the control group and Dg. 1 (brown), 2 (blue), 3 (red) and 4 (green) depending on the median methylation of the MAL. (B) ROC curve with AUC values (logistic regression) for samples from the control group and Dg. 1 (brown), 2 (blue), 3 (red) and 4 (green) depending on the median methylation of the CADM1. ROC, receiver operating curve; AUC, area under the curve; MAL, T-lymphocyte maturation associated protein; CADM1, cell adhesion molecule 1; Dg, diagnosis group.

