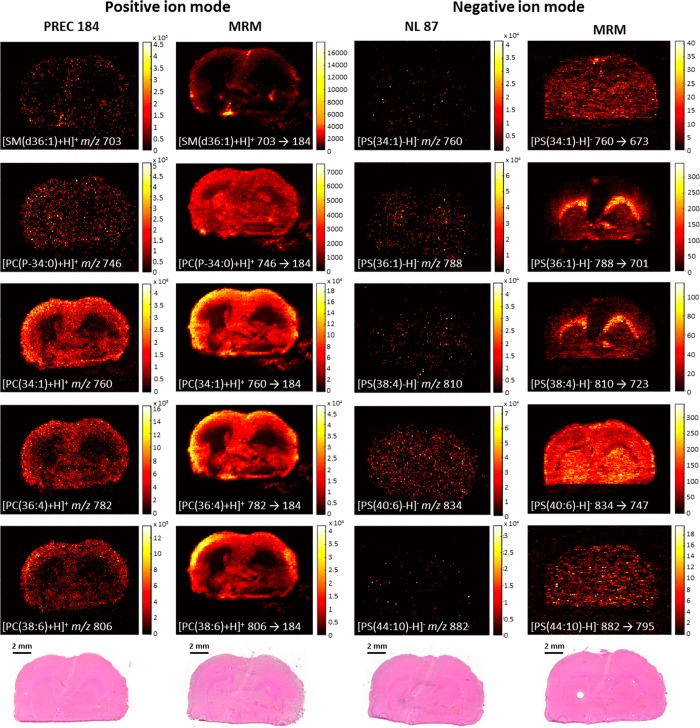
Figure 1.
TIC images acquired in scanning and MRM modes. Left two columns show images acquired in positive ion mode, and the right two columns show images acquired in negative ion mode. In the left two columns, DESI-PREC images (scan time 0.995 s) are compared with DESI-MRM images (dwell time 0.199 s/MRM) of the same species. The right two columns show the DESI-NL images (scan time 2.496 s) and their related DESI-MRM images (dwell time 0.999 s/MRM). Pixel size is 100 μm. H&E images are displayed at the bottom of each column.

