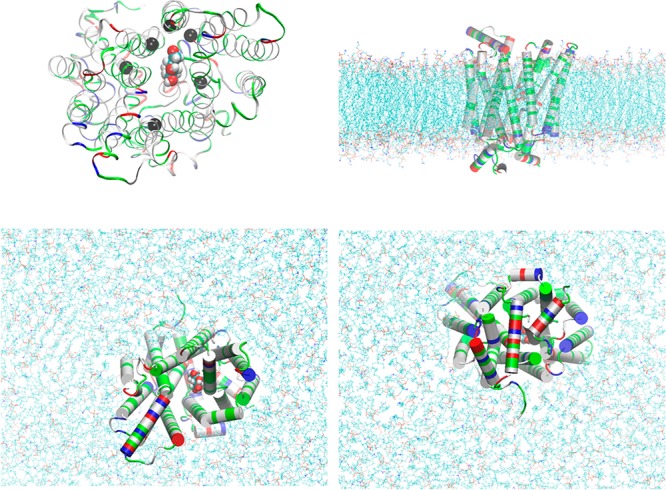
Figure 1.

GLUT3-BGLC complex embedded in a lipid bilayer. Top left panel, the protein-sugar complex viewed from the extracellular side. Protein is in ribbons colored by residue types (hydrophobic, white; hydrophilic, green; positively charged, blue; negatively charged, red). Glucose is in large spheres colored by atom names (C, cyan; O, red; H, white). Six α-carbons on six transmembrane helices in the vicinity of BGLC are marked as black spheres (Ser21CA on TM1, Ser71CA on TM2, Val163CA on TM5, Val280CA on TM7, Gly312CA on TM8, and Glu378CA on TM10), which are chosen as six centers for the helices to pivot. Their z-coordinates (six degrees of freedom in total) are fixed during simulations after long equilibration but their x- and y-degrees of freedom are free in all simulations. Bottom left, top right, and bottom right panels, respectively, the extracellular, the side, and the intracellular views of the protein–sugar complex embedded in a lipid bilayer. The coordinates were from the last frame of 200 ns MD to fully equilibrate the system. Waters, ions, and some lipids are not shown for clear views of the protein (in cartoons colored by residue types). The lipids are shown in lines colored by atom names (in addition to the afore-listed, P, purple; N, blue). All molecular graphics were rendered with VMD[28].
