Figure 6.

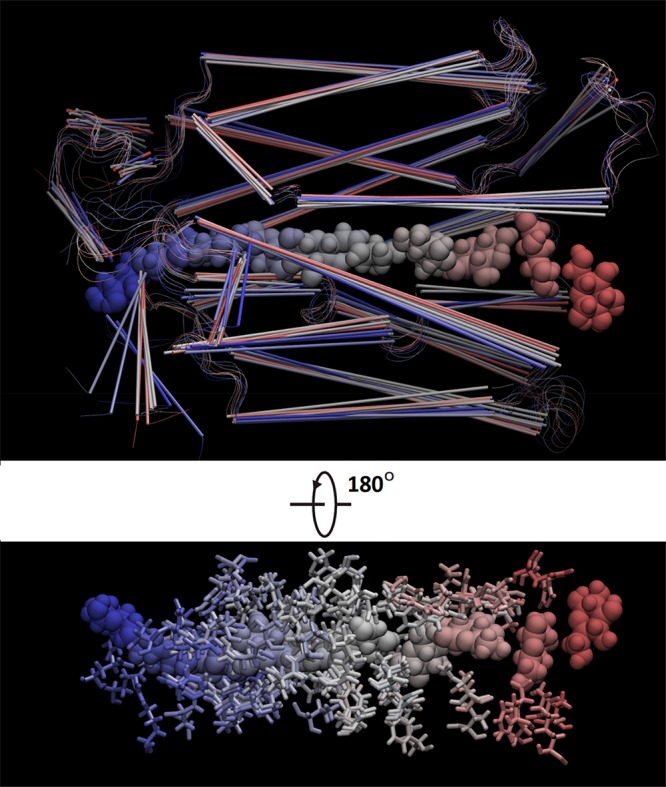
GLUT3 and BGLC shown in nine representative frames along the glucose diffusion path. BGLC is shown as large spheres, protein as cartoons, and the protein side chains within 5 Å of BGLC as licorices, all colored by frame numbers.

GLUT3 and BGLC shown in nine representative frames along the glucose diffusion path. BGLC is shown as large spheres, protein as cartoons, and the protein side chains within 5 Å of BGLC as licorices, all colored by frame numbers.