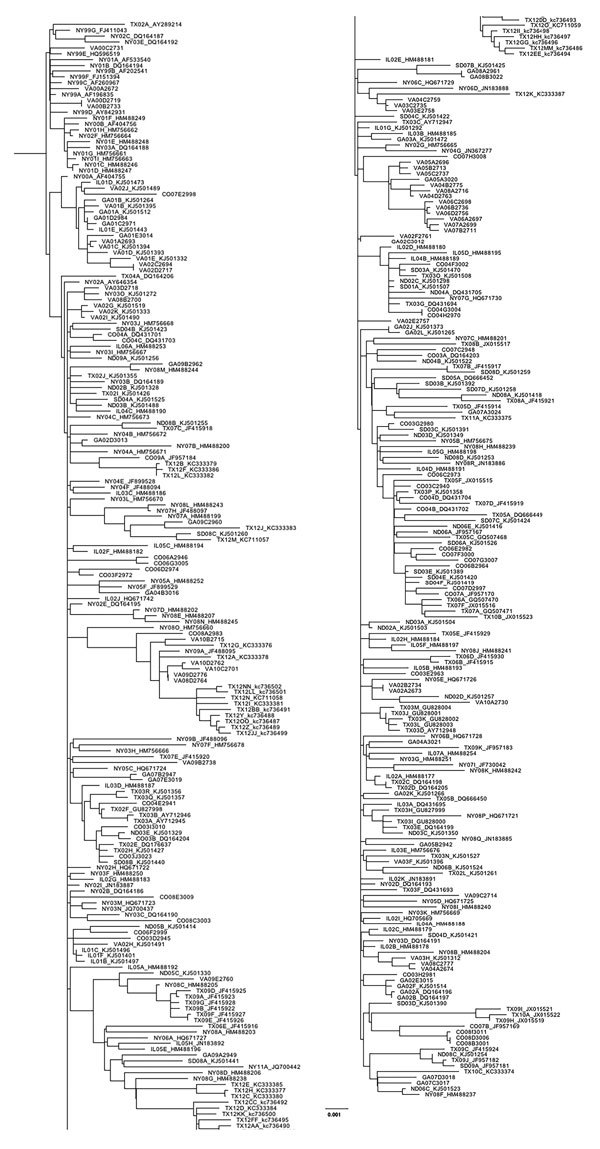
Figure 1.

Maximum-likelihood phylogeny generated with all West Nile virus sequences from New York, Virginia, Georgia, Illinois, North Dakota, South Dakota, Texas, and Colorado (n = 379) in study of terrestrial bird migration and West Nile virus circulation, United States. Sequence names include the 2-letter state abbreviation to indicate the origin of isolation, followed by the year. Multiple isolates collected from the same state within the same year are differentiated by letter. GenBank accession numbers are provided for all taxa that were not sequenced in this study. Scale bar indicates nucleotide substitutions per site.
