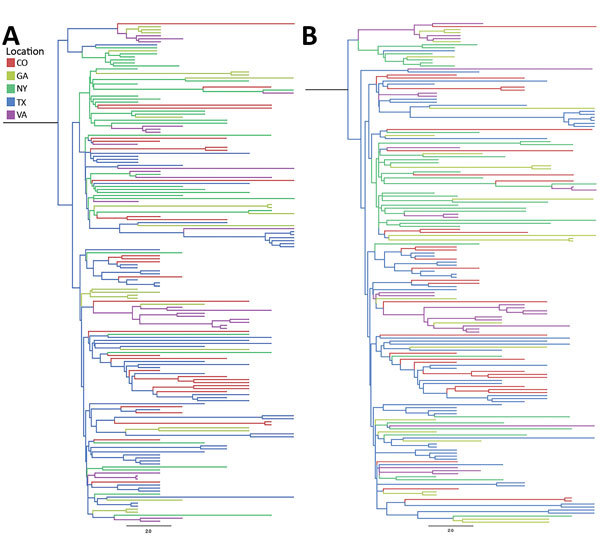
Figure 5.

Incidence-controlled phylogeny of Eastern and Central flyways, United States. Sequences were down-sampled such that the number of sequences was proportional to the annual incidence of West Nile neurologic disease incidence for each location between 2001 and 2009. Down-sampling was undertaken twice (A and B) to ensure that the reduction in sequences did not result in a substantial loss of diversity. Illinois, North Dakota, and South Dakota were not included in the incidence-control analysis because too few sequences were available to support down-sampling. Bayesian approaches were used to generate maximum-clade credibility trees. Scale bars indicate nucleotide substitutions per site.
