
Figure 6.
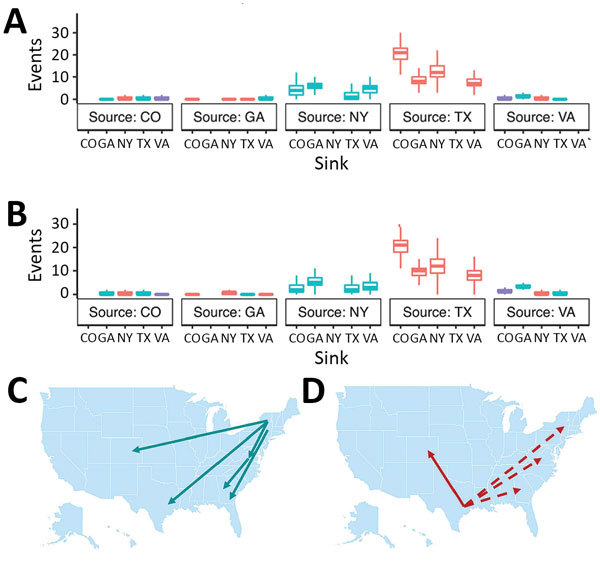
Summary of Markov jump analysis performed on the incident-controlled phylogeny. A, B) The results of the Markov jump analysis for each down-sampled dataset are summarized as box plots. Box tops indicate third quartiles, box bottoms indicate first quartiles; horizontal bars within boxes indicate medians; error bars indicate maximums and minimums. Red, northward movement; teal, southward movement; purple, movement that is neither north nor south; dotted arrows, movement that was not observed in the incident-controlled down-sampling because of an insufficient number of sequences. C, D) Movement originating in the eastern and central United States. Only Markov jumps that occurred >2 times are depicted.