
Figure 7.
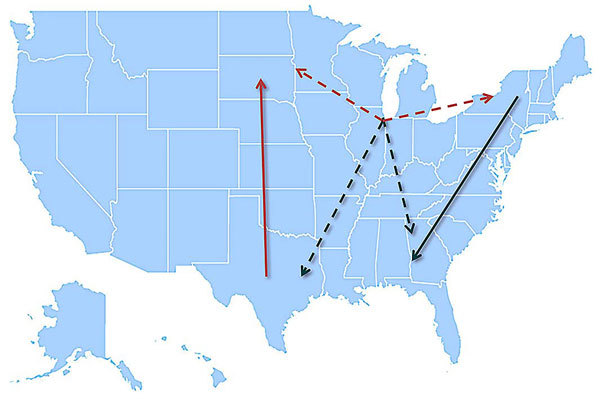
Model summarizing the general patterns of West Nile virus movement in the United States. Red, northward movement; teal, southward movement; dotted arrows, relationships that could not be confirmed in incident-controlled datasets because of an insufficient number of sequences.