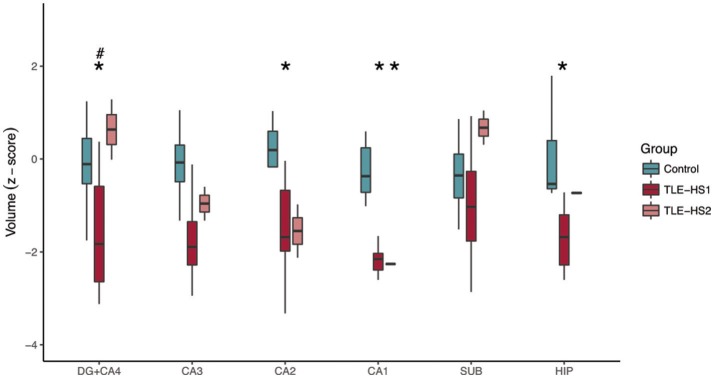
Figure 5.
Z-scored hippocampal subfield volumes (at body level) of control cases (green boxplots) and TLE patients with type 1 HS (TLE-HS1, dark red boxplots) or HS type 2 (TLE-HS2, light red), measured in 3T MRI. TLE-HS1 has lower volumes than controls in DG+CA4, CA2, CA1, and in the whole hippocampal volume, whereas TLE-HS2 has only lower volume in CA1. TLE-HS1 also has lower volume than TLE-HS2 in the DG+CA4. The asterisks indicate difference from controls, and the hash/pound sign indicates difference from TLE-HS1. DG, dentate gyrus; SUB, subiculum; HIP, all hippocampal subfields.

