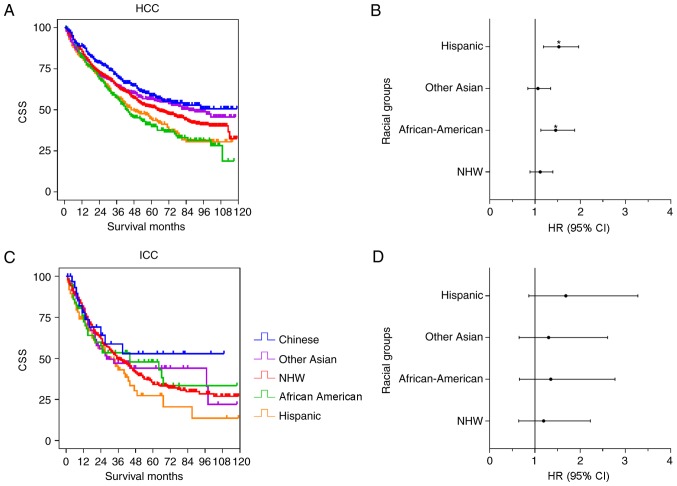
Figure 4.
Univariate and multivariate analysis of CSS for patients with HCC and ICC following surgery. The results of the univariate and multivariate analysis are presented as a Kaplan-Meier curve and forest plotting, respectively. Forest plotting depicted the HR and 95% CI of each racial group, compared with the Chinese group, as a reference. (A) The Kaplan-Meier curve for patients with HCC. (B) Forest plotting of CSS for patients with HCC. (C) The Kaplan-Meier curve for patients with ICC. (D) Forest plotting of CSS for patients with ICC. *P<0.05. CSS, cause-specific survival time; NHW, non-Hispanic white; HR, hazard ratio; CI, confidence interval; ICC, intrahepatic cholangiocarcinoma; HCC, hepatocellular carcinoma.

