FIG 1.
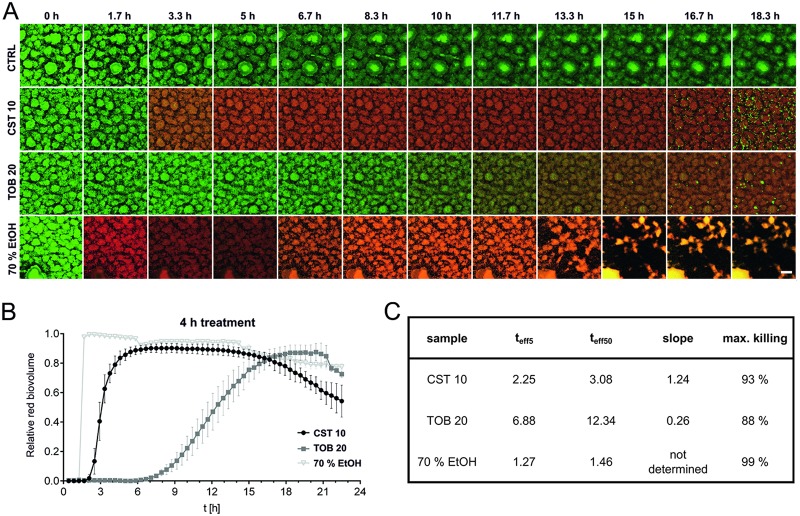
Killing dynamics of P. aeruginosa biofilm cells. Biofilms were cultivated for 48 h and treated with 10 µg ml−1 of colistin, 20 µg ml−1 of tobramycin, or 70% EtOH (killing control) for a period of 4 h. The first image series was acquired at the time of the flow start. The maximum antibiotic concentration was reached after approximately 90 min. Following a 4-h administration of the drug, the antibiotics were washed off the system within approximately 2 h. (A) Maximum-intensity projections of untreated control (CTRL, first row), colistin-treated (second row), tobramycin-treated (third row), and ethanol-treated (fourth row) biofilms at given intervals are shown. Green, GFP fluorescence; red, PI fluorescence. Scale bar: 50 µm. (B and C) Increase of the relative red biovolume (PI signal) over time (B) and relevant parameters describing the killing curve (C). teff5 and teff50, time points when 5% and 50%, respectively, of the biofilm cells are killed (slope of the sigmoidal curve and maximal killing rate). Data are means ± SDs for two positions in two independent experiments.

