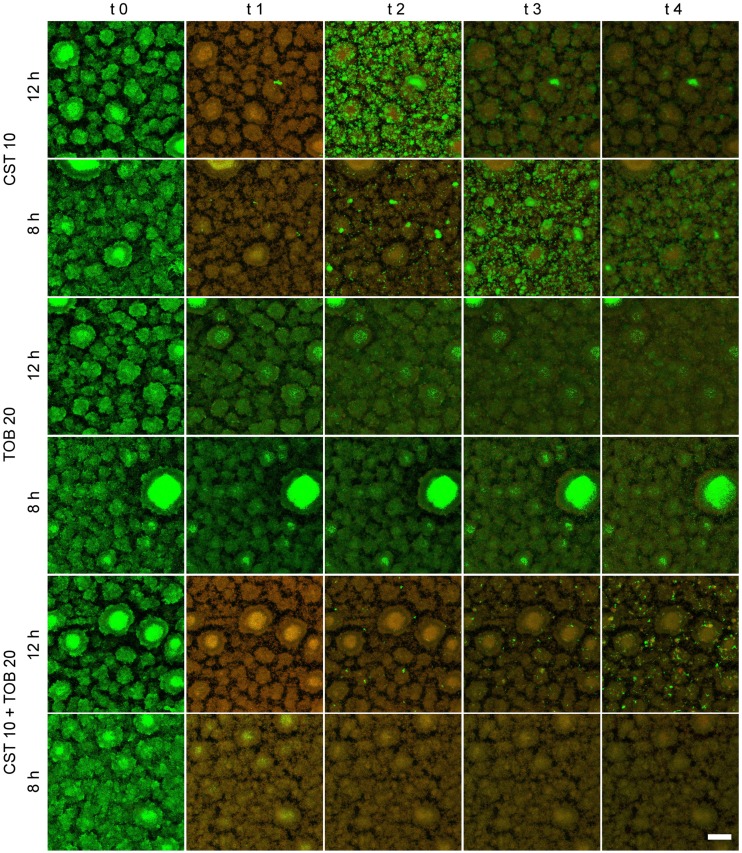
FIG 4.
Killing dynamics in biofilms treated over a period of 48 h. The biofilms were exposed four times for 1 h to 10 µg ml−1 of colistin, 20 µg ml−1 of tobramycin, or a combination of the two. Two treatment intervals were tested: the first set was treated every 8 h and the second set every 12 h. Representative maximum-intensity projections of biofilms before treatment and 1 h after the time points of antibiotic addition are shown. Green, GFP fluorescence; red, PI fluorescence. Scale bar: 50 µm.

