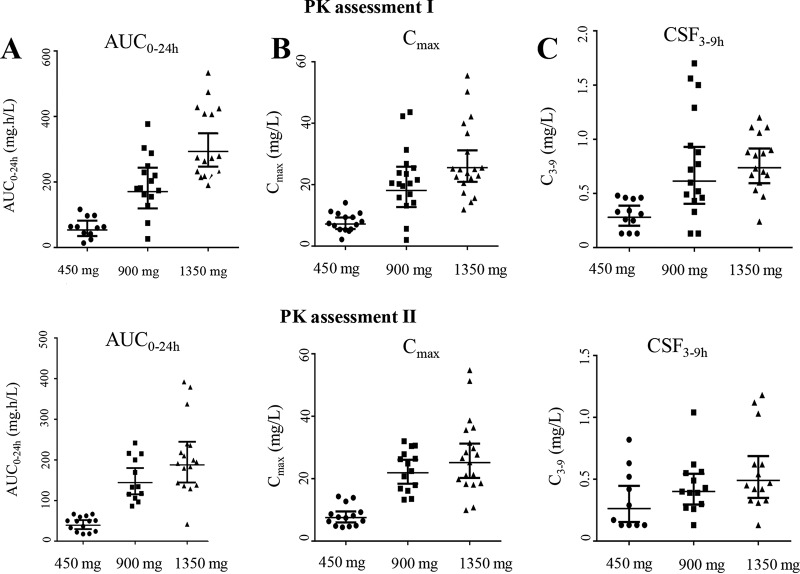
FIG 2.
Distribution of rifampin. Area under the concentration-time curve from 0 to 24 h after the dose (AUC0–24) (A), maximum concentration in plasma (Cmax) (B), and concentration in CSF at 3 to 9 h after the dose (C), at the first (day 2 ± 1 of treatment, top) and second (day 10 ± 1of treatment, bottom) pharmacokinetic (PK) assessments. The x axes show the three arms in the study using standard 450 mg, 900 mg, or 1,350 mg (10, 20, and 30 mg/kg) oral rifampin combined with other TB drugs. Data points represent values from individual patients. Horizontal lines represent geometric means with 95% confidence intervals.

