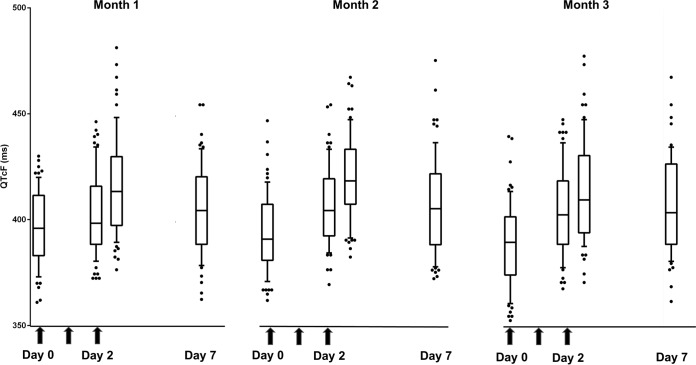
FIG 1.
Electrocardiographic QTcF measurements over the study period. Results are median and interquartile ranges (IQR) of all QTcF measurements over the 63 days of study. Arrows are the DHA-PQP doses. Day 0 corresponds to the 0-h value of each month, day 2 values correspond to 48-h (predose) and 52-h (4 h postdose) measurements, and day 7 value is the day 7 measurement of each month.

