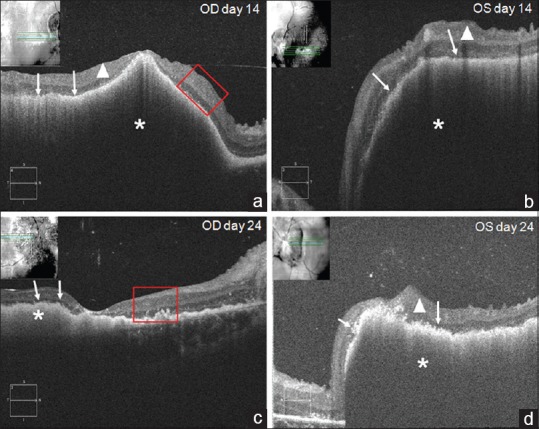
Figure 4.

The dynamic changes of the retina from day 14 (a and b) to day 24 (c and d) after imatinib treatment by optical coherence tomography. Continuous optical coherence tomography revealed dramatically resorbed subretinal hemorrhage (asterisk in a–d), neuro-retinal inner layers edema (triangles in a, b and d), disturbance of the IS/OS layers and thinned out layers (arrows in a–d)
