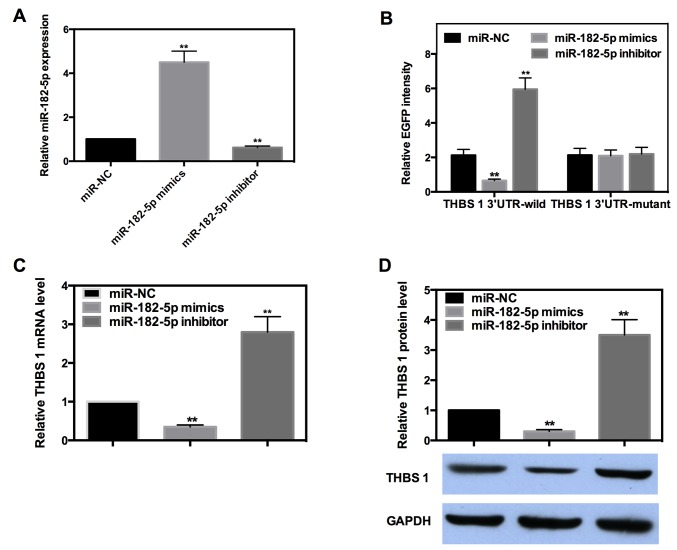
Figure 4.
miR-182-5p directly targets the 3′-UTR of THBS-1 and downregulate its expression. (A) The efficiency of miR-182-5p mimics and inhibitors. (B) EGFP reporter analysis was performed to detect the EGFP intensity after the wild- or mutant-type of 3′-UTR was cotransfected with miR-182-5p mimics, miR-182-5p inhibitor or miR-NC in INS-1 cells. EGFP intensity was normalized to the red fluorescent protein fluorescence intensity. (C) Reverse transcription-quantitative polymerase chain reaction analysis was used to detect the mRNA expression of THBS 1 when the expression of miR-182-5p was altered. β-actin was used as the corresponding control. The relative mRNA expression of miR-NC group was normalized as 1. (D) Western blot analysis was used to detect the relative protein expression level of THBS 1 when miR-182-5p was overexpressed or inhibited. The relative protein expression was determined as the ratio to GAPDH. Relative protein expression of miR-NC group was normalized as 1. Data are expressed as the mean ± standard deviation. **P<0.01 vs. miR-NC. miR, microRNA; UTR, untranslated region; THBS-1, thrombospondin 1; NC, negative control; EGFP, enhanced green fluorescent protein.

