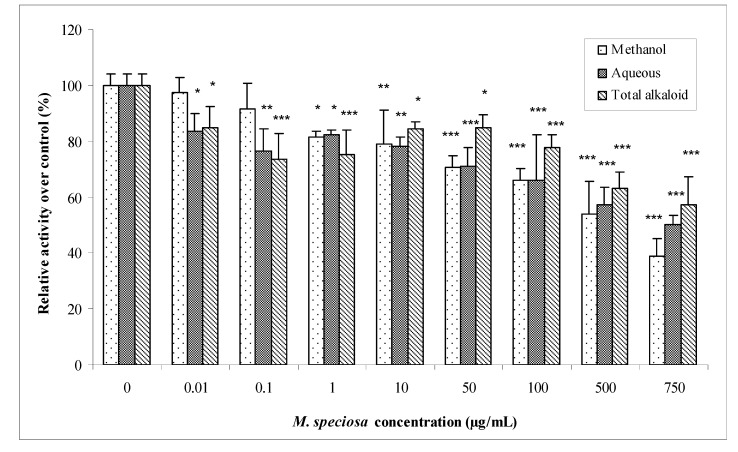
Figure 1.
Percentage of GSTs specific activity compared with control for in vitro study. Values are mean ± SD for five determinations (n = 5). Statistical analysis was conducted using one way ANOVA and Dunnet test. * p < 0.05 vs. control (no M. speciosa), ** p < 0.01 vs. control (no M. speciosa), *** p < 0.001 vs. control (no M. speciosa).

