Figure 1.
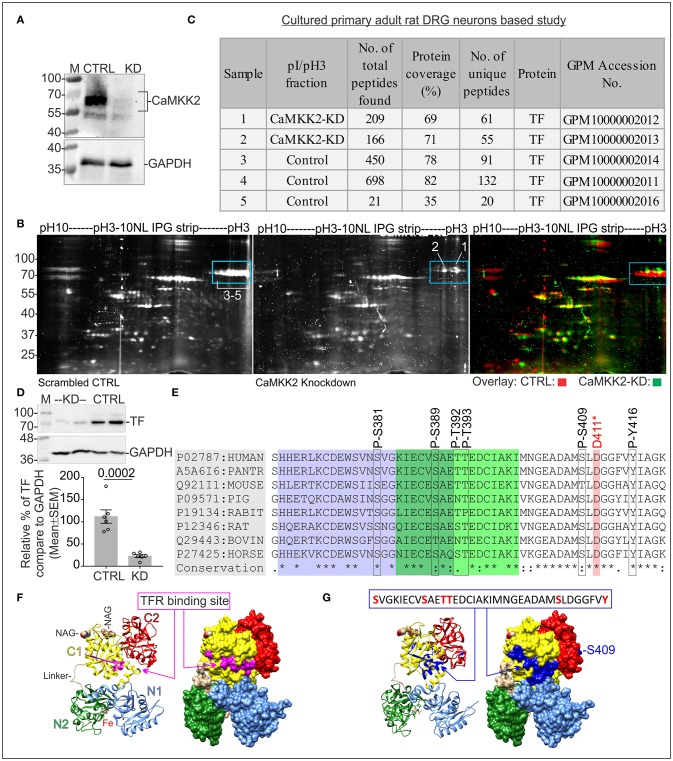
Protein profiling in CaMKK2 KD cultured adult primary rat DRG neurons. (A) Immunoblots showing expression of CaMKK2 and GAPDH. CTRL, scrambled control, KD, knockdown. The LNP based delivery of siRNAs knocked down 98% of CaMKK2 in DRG neurons. The protein lysates were obtained from DRG neurons cultured for 48 h following transfection. (B) Oriole stained IEF/SDS-PAGE gel showing focused proteins. Blue rectangle areas show the difference in the focused protein fractions. The gel images (CTRL and KD) were false-colored and overlaid in the right panel to highlight the differences. Arabic numerals indicate gel spots that were used for in-gel trypsin digestion and mass spectrometric identification of the proteins. The numbers are equivalent to the sample numbers in (C). (C) Table summarizes mass spectrometry findings. Data is accessible at Global Proteome Machine (https://thegpm.org) website using the GPM identifiers. (D) Immunoblots showing expression of TF and GAPDH. CTRL, scrambled control; KD, knockdown. The protein lysates were obtained from DRG neurons cultured for 72 h following transfection. Bottom panel: representative scatter plot showing the relative abundance of TF normalized to GAPDH expression. N = 6 replicates from 3 independent experiments. The p-value by t-test (unpaired). (E) Conserved TFR binding motif in TF in different mammalian species showing the P-TF residues identified by mass spectrometry. D-411 residue is involved in iron binding. The purple and green highlighted residues indicate the TFR binding site identified by cryo-EM (Cheng et al., 2004) and epitope mapping (Teh et al., 2005). (F) Ribbon representation of hTF showing TFR binding site (Wally et al., 2006). TF modeled using diferric bound human serum TF crystal structure, PDB: 3QYT. The subdomains: N1 (residues 1-92 and 247-330) in blue, N2 (Residues 93-246) in green, C1 (Residues 340-325 and 573-679) in yellow, C2 (residues 426-572) in red, and the peptide linker in brown. Fe(III) ions are represented as sphere models in black. The two N-acetyl-glucosamine moieties (NAG and NAG') are represented as sphere models. Molecular graphics were prepared using UCSF Chimera package (Pettersen et al., 2004). Right panel: molecular surface presentations showing TFR binding site highlighted in pink. (G) Ribbon and molecular surface model of TF showing epitopes containing the phosphorylated residues (blue).

