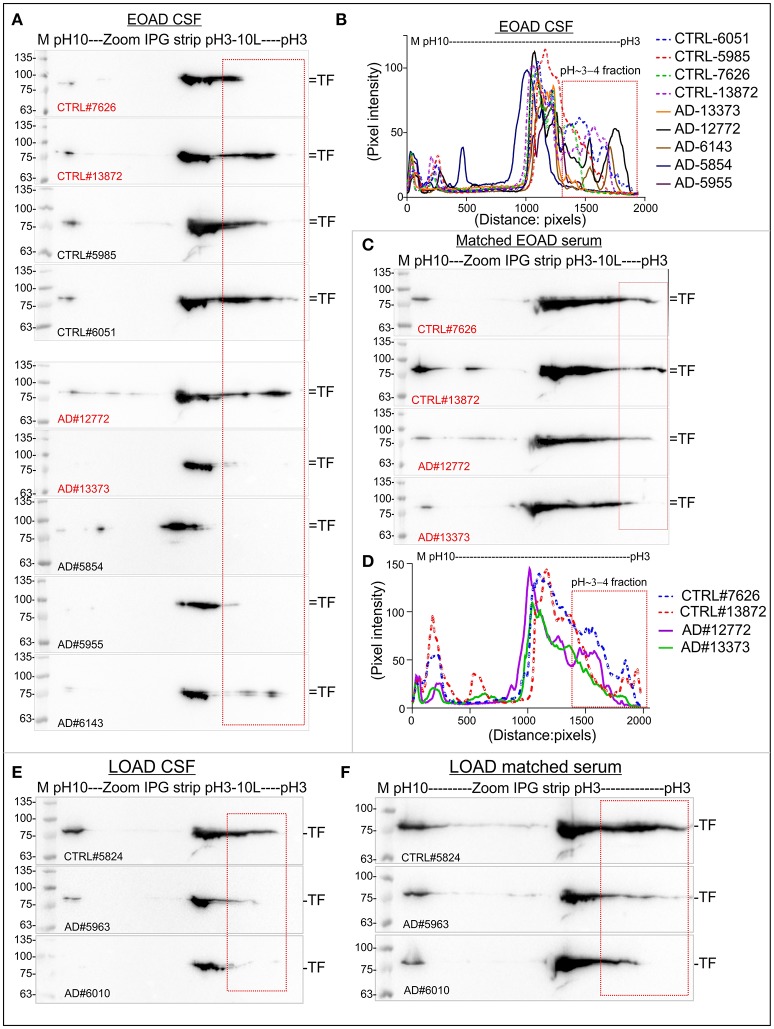
Figure 10.
Relative abundance of P-TF reduced in the CSF and serum of postmortem human EOAD and LOAD patients compared to the controls. (A,C,E,F) Immunoblots showing charged fractions of TF in the CSF and serum samples of postmortem human EOAD and LOAD patients and unaffected controls. (B,D) plot profile of the immunoblots presented in (A,C). The plot profile was created using ImageJ. Red marked are represents P-TF (pH~3-4 fractions). Detailed sample information is given in Table 3. The Red highlighted samples represent matched serum and CSF collected from same individual.

