Figure 2.
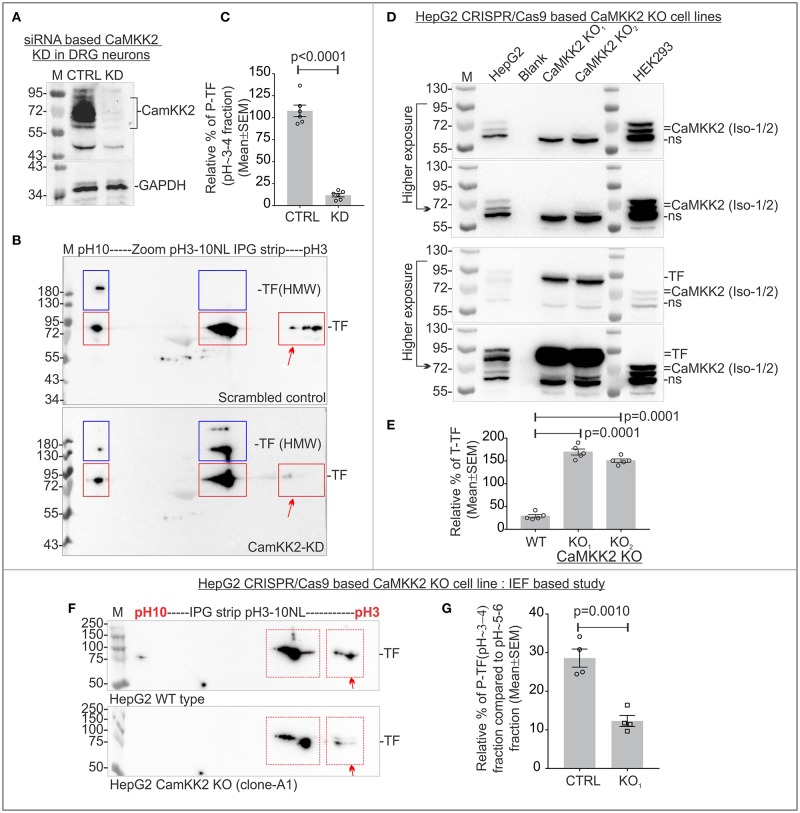
P-TF significantly reduced in the CaMKK2 KD cultured primary adult rat DRG neurons and multiple CaMKK2 KO human cell lines. (A) Immunoblots showing relative expression of CaMKK2, and GAPDH in CaMKK2 KD DRG neurons. CTRL, scrambled control; KD, knockdown. (B) Immunoblots showing charged fractions of TF in the DRG neurons. Red rectangles indicate pH/pI~3, ~5-6 and ~9-10 fractions of native TF. Blue rectangles indicate higher molecular weight (HMW) form of the TF. (C) Scatter plot showing relative percentage of P-TF. The percentage was normalized relative to the intensity of pH~9-10 fraction. N = 6 from 3 independent experiments. The p-value by t-test (unpaired). (D) Immunoblots showing expression of CaMKK2 and TF in CRISPR/Cas9 based CaMKK2 KO HepG2 cells and wild-type HEK293 cells. KO1 and KO2 represent independently selected CaMKK2 KO HepG2 clonal cell lines. Different exposure of the same blot was given to highlight bands at different intensities. (E) Scatter plot showing the relative amount of total TF. The percentage was calculated relative to GAPDH (not shown) intensity. N = 6 from 2 independent experiments. The p-value by t-test (unpaired). (F) Immunoblots showing charged fraction of the TF in the wild-type (WT) and CaMKK2 KO1 HepG2 cells. (G) Scatter plot showing the relative amount of P-TF. The relative intensity of the P-TF was calculated based on the intensity of pH~5-6 fraction. N = 4 from 4 independent experiments. The p-value by t-test (unpaired).

