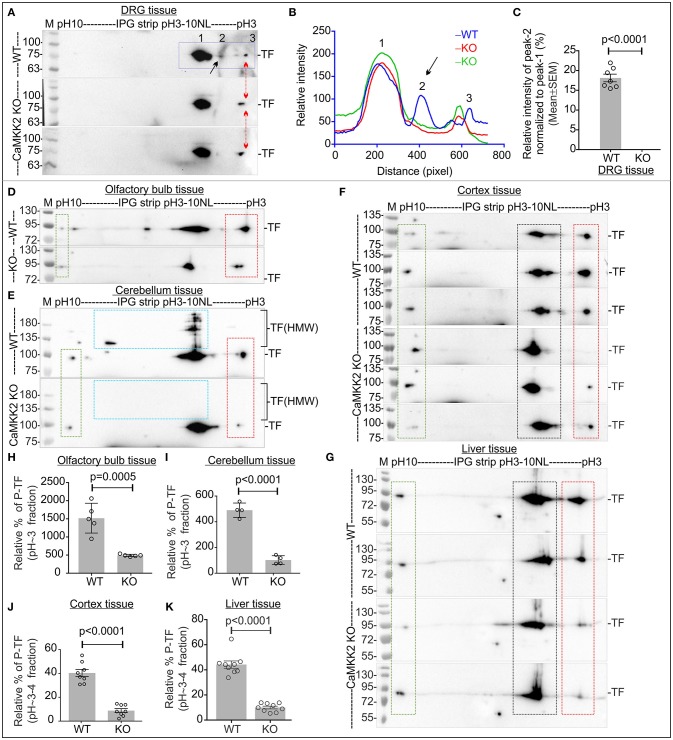
Figure 6.
P-TF was ubiquitously and significantly reduced in the CaMKK2 KO mice. (A,D–G) Immunoblots showing charged fractions of TF. Rectangle areas represent charged fraction of TF at different pH/pIs. The red arrow/red square indicates altered P-TF (pH~3-4 fractions). The green rectangle area represents TF fraction which was used to normalize the intensity of the pH~3-4 fractions in the red square area. (B) Intensity profile of the focused spots presented in the immunoblots in (A), blue squared area. The spots are marked with Arabic numerals and spot 2 was quantified. (C) Scatter plot showing the relative intensity of spot 2 in pH~3-4 fractions of TF. N = 7 replicates from 3 mice in each category. The p-value by t-test (unpaired). (H–K) Scatter plot showing the relative amount of P-TF (pH~-4 fractions) in olfactory bulb, cerebellum, cortex and liver tissues, respectively. N = 5/4/7/8 replicates from 3 to 4 KO and wild-type mice, respectively. The p-value by t-test (unpaired).

