Figure 7.
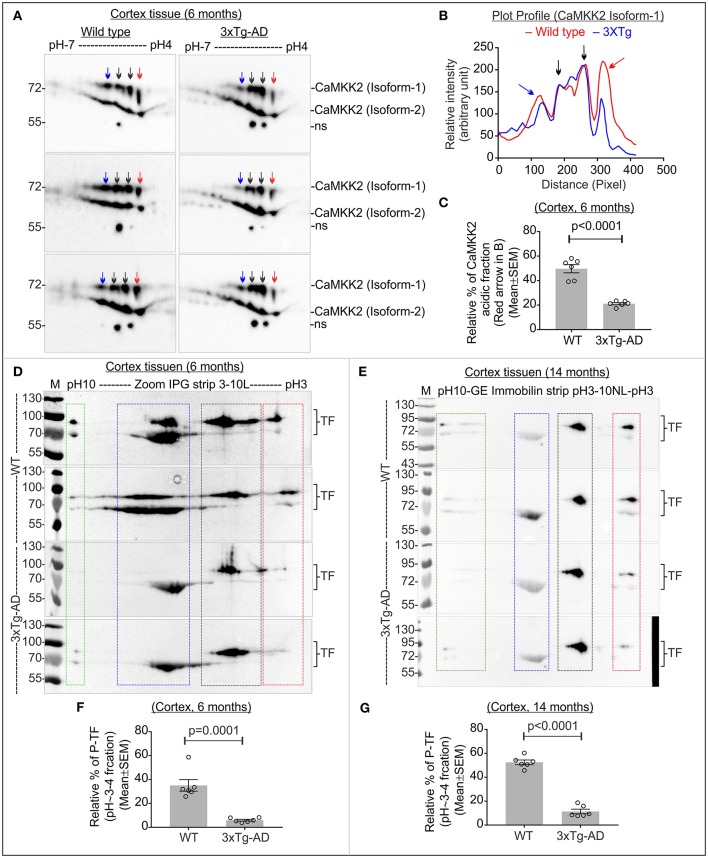
Altered CaMKK2 and reduced P-TF in 3xTg-AD mice. (A) Immunoblot showing charged fractions of CaMKK2 isoform 1 and 2 in 6 months' old wild-type and 3xTg-AD mice. Colored arrows indicate different charged fractions. Linear pH 4-7 IPG strips were used to resolve closely spaced CaMKK2 charged fractions. (B) Plot profile showing relative intensity of the focused CaMKK2 isoform-1 spots. (C) Scatter plot showing relative percentage of the comparatively more negative charged fraction (red arrow) of CaMKK2 isoform-1. The spots marked with black arrows were used for normalization because their intensity was not altered in different categories. (D,E) Immunoblots showing charged fractions of TF in 6 and 14 months old 3xTg-AD mice cortex tissues. The colored rectangle indicates different charged fractions. (F,G) Scatter plot showing relative intensities of the P-TF (red rectangle). The intensities of pH~5-6 fractions were used for normalization. N = 6 replicates from 3 mice in each category. The p-value by t-test (unpaired).

