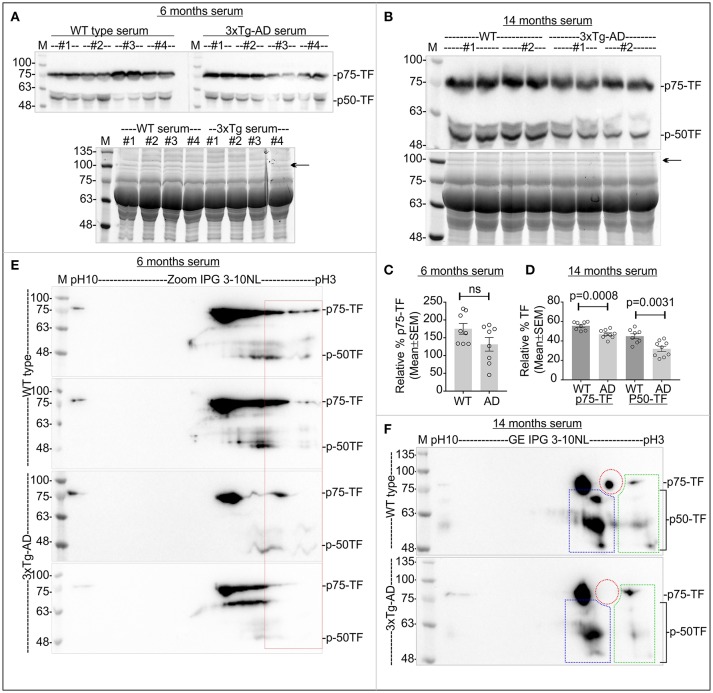
Figure 9.
Relative abundance of total TF and P-TF in the serum samples from early and late 3xTg-AD and age-matched control mice. (A,B) Top Panels: Immunoblots showing total TF level in the serum. Bottom panels: SDS-PAGE gel stained with Oriole to show total protein loading. Black arrows indicate the band used for normalization of total TF in the serum. (C,D) Scatter plot showing relative abundance of TF in the serum. N = 8 (2 replicates from 4 mice in each category. The p-value by t-test (unpaired). (E,F) Immunoblots showing charged fractions of TF. Red dotted area indicates P-TF (pH~3-4 fractions). Colored dotted rectangles in (F) indicate different charged fractions of the TF that also exhibited the marked difference between wild-type 3xTg-AD mice.

