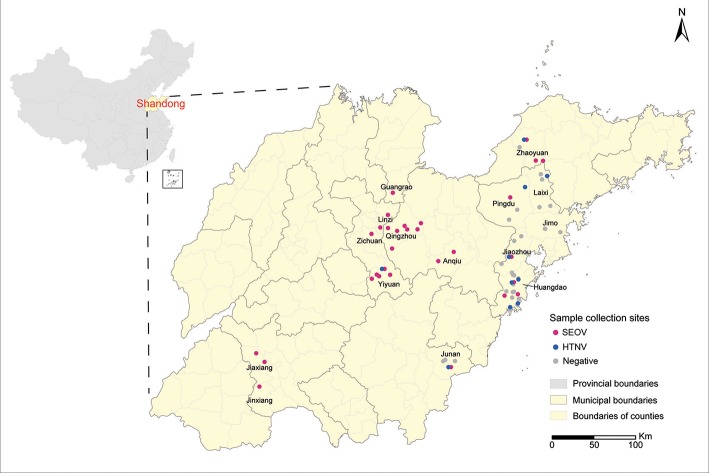
Figure 1.
Sample collection sites. Sample collection sites are represented by dots colored according to the disease etiology (red, Seoul virus; blue, Hantaan virus; gray, negative). Map was obtained from the Chinese Academy of Surveying & Mapping. Geographic coordinates of each sample collection site were obtained using the Baidu Coordinates Pick-up System, and were indicated on the map using the ArcGIS 10.2 software.

