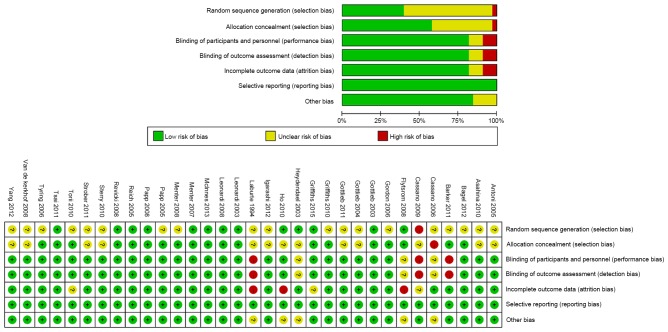
Figure 2.
Risk of bias of the included studies. +, low risk of bias; ?, unclear risk of bias; -, high risk of bias. The quality evaluation map indicates that, regarding random sequence generation (selection bias) and allocation concealment (selection bias), many references have an unclear risk of bias and few references have high risk of bias. However, regarding incomplete outcome data (attrition bias), blinding of participants and personnel (performance bias) and blinding of outcome assessment (detection bias), ~10% references have high risk of bias and 10% references have an unclear risk of bias. The included references showed no evidence of selective reporting (reporting bias) in the included references-all references showed a low risk of bias.

