Figure 2.
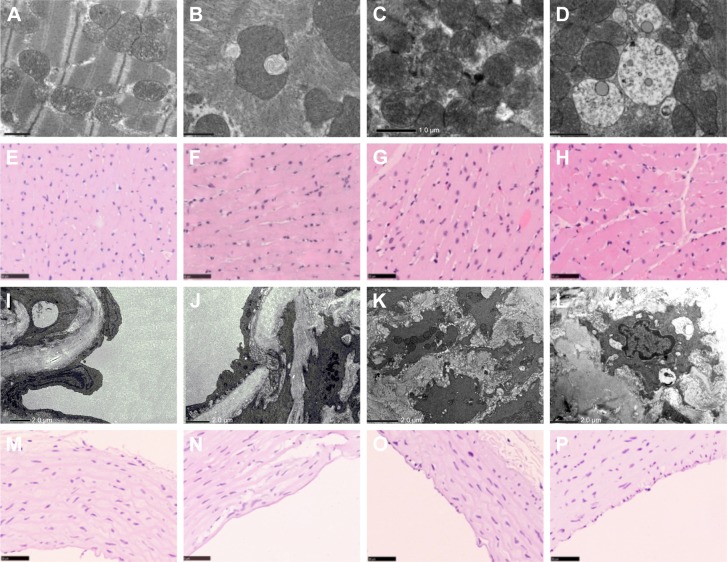
The TEM image of heart in Sprague Dawley rats triggered by SiNPs, Pb, and co-exposure: (A) control group, (B) SiNPs group, (C) Pb group, (D) SiNPs + Pb group. The H&E image of heart in Sprague Dawley rats triggered by SiNPs, Pb, and co-exposure: (E) control group, (F) SiNPs group, (G) Pb group, (H) SiNPs + Pb group. The TEM image of aortic arch in Sprague Dawley rats triggered by SiNPs, Pb, and co-exposure: (I) control group, (J) SiNPs group, (K) Pb group, (L) SiNPs + Pb group. The H&E image of aortic arch in Sprague Dawley rats triggered by SiNPs, Pb, and co-exposure: (M) control group, (N) SiNPs group, (O) Pb group, (P) SiNPs + Pb group.
Abbreviations: SiNPs, silica nanoparticles; Pb, lead acetate; TEM, transmission electron microscopy.

