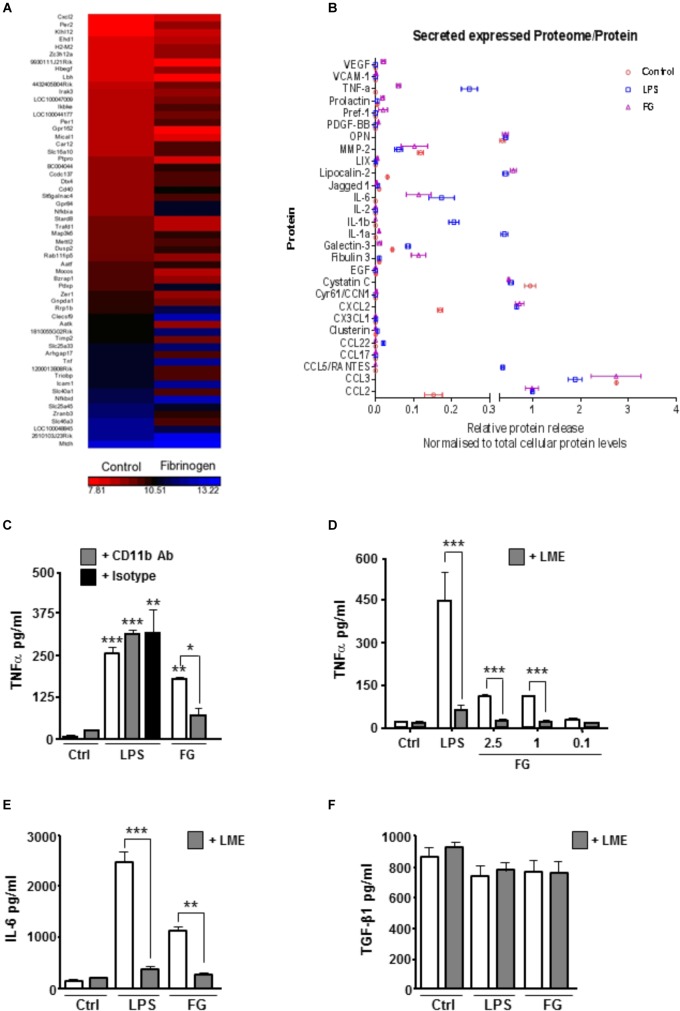
FIGURE 1.
FG induces early upregulation of inflammatory related genes and release of inflammatory cytokines. (A) Gene microarray performed on the BV2 microglial cell line after Fibrinogen (2.5 mg/ml) exposure for 6 h compared with non-stimulated (Control) BV2 cells at 6 h. (B) Proteome array performed on primary microglia following 24 h of stimulation with lipopolysaccharide (LPS, 1 μg/ml), Fibrinogen (FG, 2.5 mg/ml) or non-stimulated cells (Control). (C) TNFα secretion in cell culture medium by ELISA following treatment of primary microglia for 24 h with LPS (1 μg/ml), FG (2.5 mg/ml) or non-stimulated (Ctrl) ± MAC-1 receptor blocking antibody ( + CD11b, 10 μg/ml) or rat IgG as isotype control ( + IgG, 10 μg/ml). (D) ENGCs treated for 24 h with LPS (1 μg/ml), FG (0.1–2.5 mg/ml) or non-stimulated (Ctrl), and where indicated, pre-treated with 25 mM leucine-methyl-ester ( + LME) for microglia ablation, followed by ELISA analysis of TNFα secretion in culture medium. (E) ENGCs treated as (D) followed by ELISA analysis of IL-6 secretion in culture medium. (F) ENGCs treated as (D) followed by ELISA analysis of TGFβ secretion in culture medium. In all graphs, data are the mean ± SEM from 3 independent experiments with internal replicates of at least 3. Significance levels compared with control condition unless otherwise indicated, ∗p < 0.05, ∗∗p < 0.01, ∗∗∗p < 0.001.

