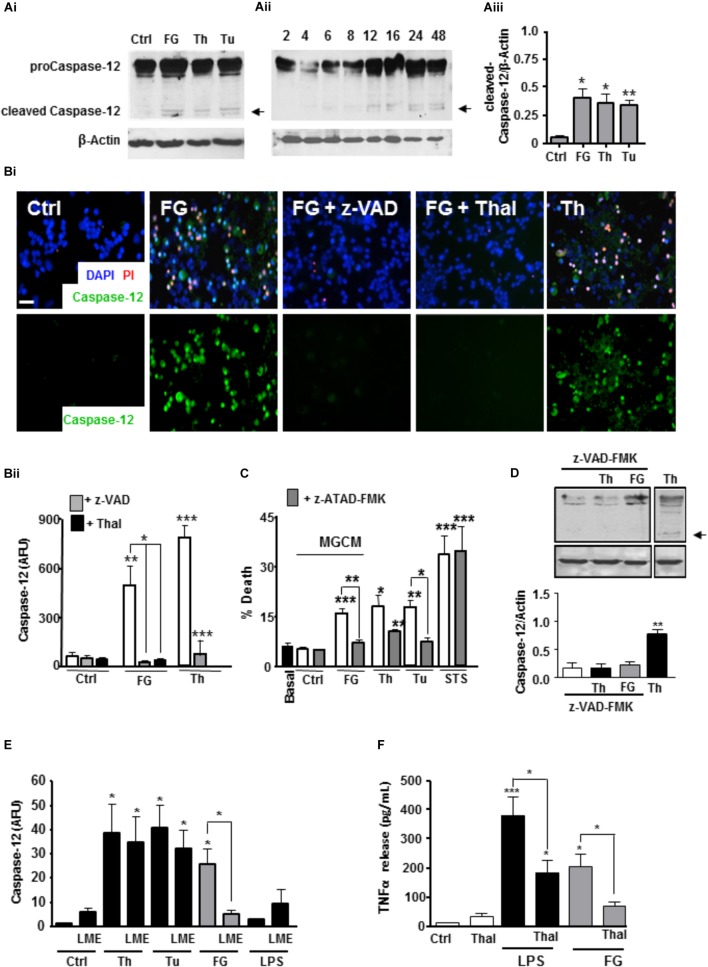
FIGURE 4.
FG inducesneuronal ER stress signaling via microglial TNFα release. (A) Expression of pro-caspase 12 (55 kDa) and cleaved active caspase 12 (36 kDa) in ENGCs from control cultures (Ctrl), or cultures treated with FG (2.5 mg/ml), thapsigargin (Th, 2 μM), or tunicamycin (Tu, 1 μg/ml) for 24 h as shown in the representative blot (Ai), and quantified by densitometry of cleaved caspase-12 relative to β-Actin levels (Aiii). Aii represents a blot showing time course of expression of cleaved caspase-12 in ENGCs treated with FG (2.5 mg/ml) over time (h). (B) Analysis of caspase-12 activity by FITC-ATAD-FMK live cell staining in ENGCs following exposure to FG + /- thalidomide (Thal; 40 μM) or z-VAD-FMK (z-VAD; 1 μg/ml), or thapsigargin (Th, 2 μM) for 24 h. (Bi), Scale bar: 20 μm. Data were quantified and presented as arbitrary fluorescence units (AFU)/cell/field of view; Bii). (C) Analysis of death in ENGCs by PI live cell staining after exposure to microglial conditioned medium (MGCM) collected from cultures treated FG (2.5 mg/ml) or untreated (Ctrl) + /- direct administration of the caspase-12 specific inhibitor z-ATAD-FMK. Th, thapsigargin, 2 μM, Tu, Tunicamycin, 1 μg/ml Staurosporine (STS; 0.5 μM) was used as a positive control for neuronal death. (D) Western blot of cleaved caspase-12 in ENGCs following expose to Thapsigargin (Th, 2 μM) or FG (2.5 mg/ml) in the presence of z-VAD-FMK (1μg/ml) showing inhibition of caspase-12 cleavage (arrow). (E) Quantification of the relative active caspase-12 fluorescence intensity/cell in ENGC cultures after treatment with Th (2 μM), Tu (1 μg/ml), FG (2.5 mg/ml), or LPS (1 μg/ml) for 24 h, + /- LME pre-treatment for the depletion of microglia (LME). Data are presented in arbitrary fluorescent units (AFU)/cell/field of view). (F) ELISA of TNFα secretion from primary microglial cultures following treatment for 24 h with FG (2.5 mg/ml, or LPS (1 μg/ml), co-treated with thalidomide (Thal; 10 μg/ml). In all graphs, data are the mean ± SEM from at least three independent experiments encompassing 5 separate fields of view or from samples from at least three independent experiments. Significance levels are compared with control condition in each graph unless otherwise indicated, ∗p < 0.05, ∗∗p < 0.01, ∗∗∗p < 0.001.

