Fig. 1.
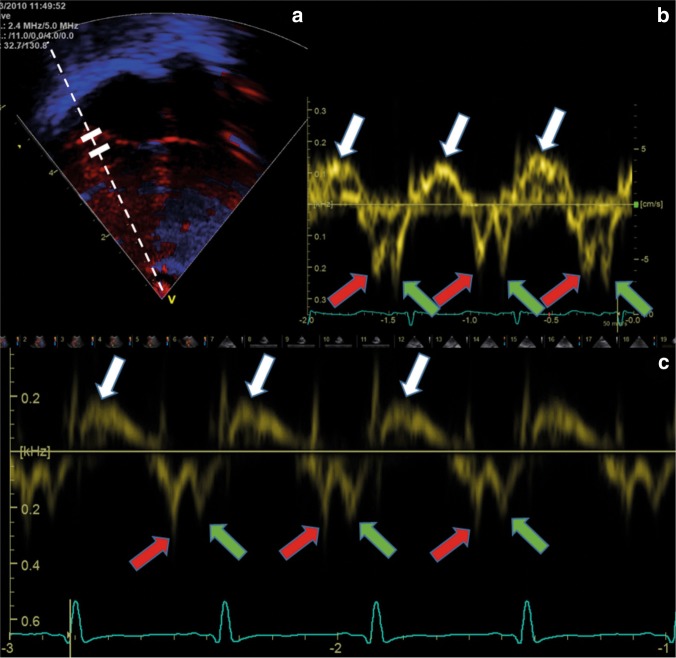
Pulsed-wave tissue Doppler velocity measurement from a term neonate, from the right lateral atrioventricular plane from the apical four-chamber view. The ultrasound system records the velocities from the area between the two calipers (the two white solid lines in the upper left panel). The dotted line denotes the direction of the ultrasound beams assessing the velocities. (Upper left panel) a Color-coded tissue Doppler image. (Upper right panel) b Spectral velocity time curve of three heart cycles, with relatively high gain setting. The upper panels (a and b) show a relatively poor image quality (blurred 2D image (a) and a broad spectral velocity–time curve (b). The lower panel c shows a velocity curve with narrower spectral curve, indicating better quality. X-axis: time. Y-axis: tissue velocity from the sample area. White arrows at the peak systolic velocities (s′), red arrows at the early diastolic velocities (e′), and green arrows at the peak velocity in atrial systole (a′)

