Fig. 4.
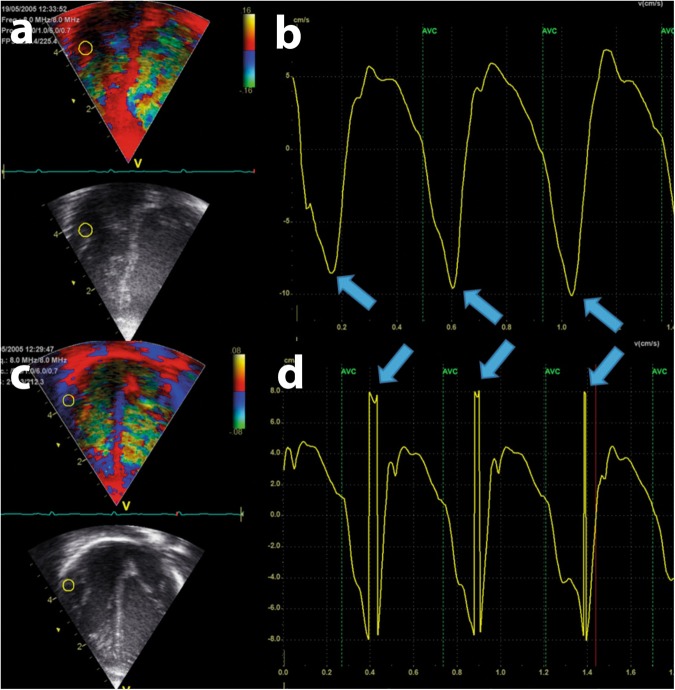
Example of non-aliased and aliased velocity measurements. Both panels show a color tissue Doppler velocity measurements of the right lateral atrioventricular plane in three consecutive heartbeats in a term neonate. The left part of both panels a and c show an apical four-chamber image with a sample area (yellow circle) of 3 × 3 mm. The right panels b and d show the velocity curves. The velocity scale is ±0.16 m/s in the upper panel and ±0.08 m/s in the lower panel. The negative peak velocity in diastole is approximately −0.09 m/s (blue arrows), within the velocity range in the upper panel but outside the velocity range in the lower panel. The ultrasound system therefore shows the velocity correctly in the upper panel and erroneously as a positive velocity close to the upper velocity limit in the lower panel. Note that there is complete fusion of diastolic velocities in the last two heart-cycles in the upper panel; it is not possible to identify two diastolic velocity peaks. X-axis: time. Y-axis: tissue velocity from the sample area

