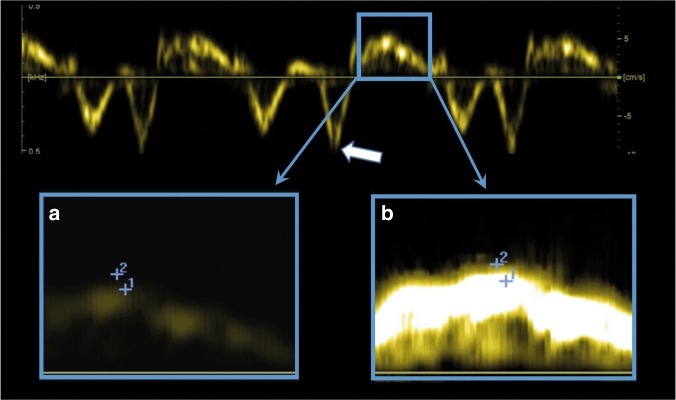
Fig. 5.
Pitfalls in image acquisition and analysis of pulsed-wave tissue Doppler images. The upper panel shows small breaks in the spectral curve when the ultrasound system records 2D images and pulsed-wave tissue Doppler spectral curve simultaneously. The a′ is false low in the second of the three heartbeats because the ultrasound system recorded the 2D image instead of the spectral curve at the time-point for the late diastolic peak (white arrow). The lower panel shows the systolic phase of one heart cycle with assessment of s′ velocity by correct (a) and by too high (b) gain setting. Measurement #1 is the correct velocity (5.1 cm/s) and measurement #2 is a false high velocity (6.1 cm/s). The only difference between the lower left and right panels is the gain setting during the off-line analysis

