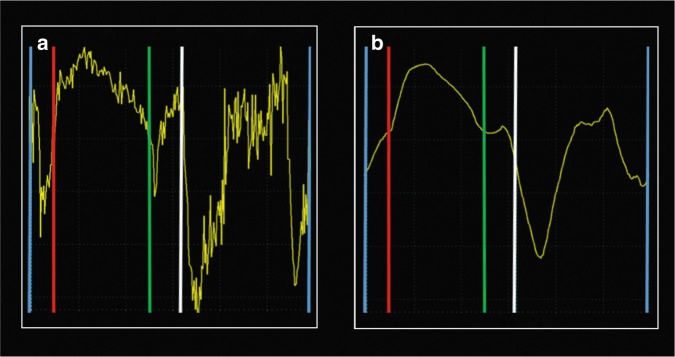
Fig. 6.
Same loop as in upper panel of Fig. 2, color-coded tissue Doppler velocity curves from a term neonate from the left lateral atrioventricular plane from the apical four-chamber view. The left curve (a) shows the velocities without time smoothing and the right curve (b) shows the velocities with too much time smoothing. Too much and too little time smoothing make interpretation of the curves difficult. Note that it is hard to identify the isovolumic contraction phase, especially in the right panel where the negative slope prior to the ejection phase is missing. Blue vertical lines denote closure of the mitral valve. Red vertical line denotes opening of the aortic valve. Green vertical line denotes closure of the aortic valve. White vertical line denotes opening of the mitral valve

