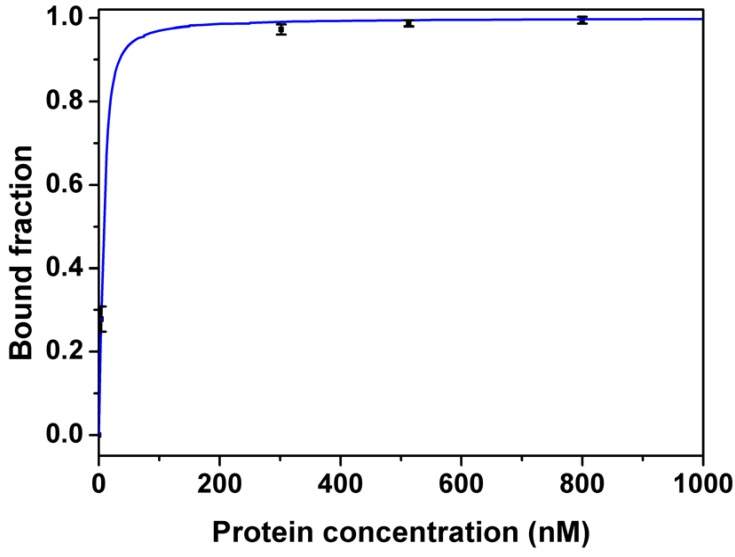
Figure 4.
Binding curves of aptamer (Apta1) to lysozyme measured by fluorescence anisotropy. 60 µL of 20 nM ssDNA was incubated with the same volume of different concentrations of lysozyme (0, 3.8, 302, 513 and 800 nM) in quartz cuvettes. The dissociation constant (Kd) was estimated using non-linear least-squares regression analysis. Full line represents the fitted data and symbols represent the measured data given as averages of three measurements. Error bars indicate the 95% confidence intervals.

