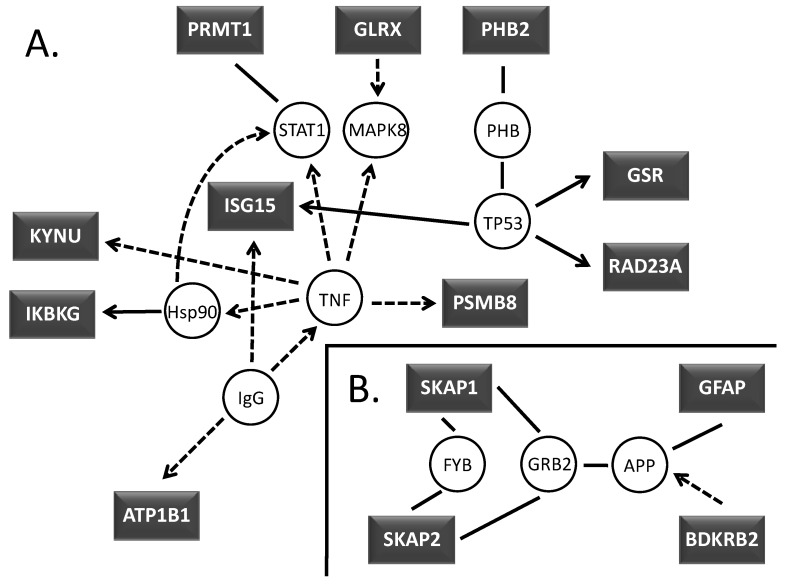
Figure 2.
Network view of associated proteins created within Ingenuity Pathway Analysis software for visualizing molecular interrelationships. (A) TNF-α and TP53, (B) SKAP and GFAP associated proteins. Coloring is based on the expression values that were uploaded with the dataset. Gray indicates the molecule was part of the dataset. Lines connecting molecules indicate molecular relationships. Dashed lines indicate indirect interactions; solid lines indicate direct interactions. The style of the arrows indicates specific molecular relationships and the directionality of the interaction.

