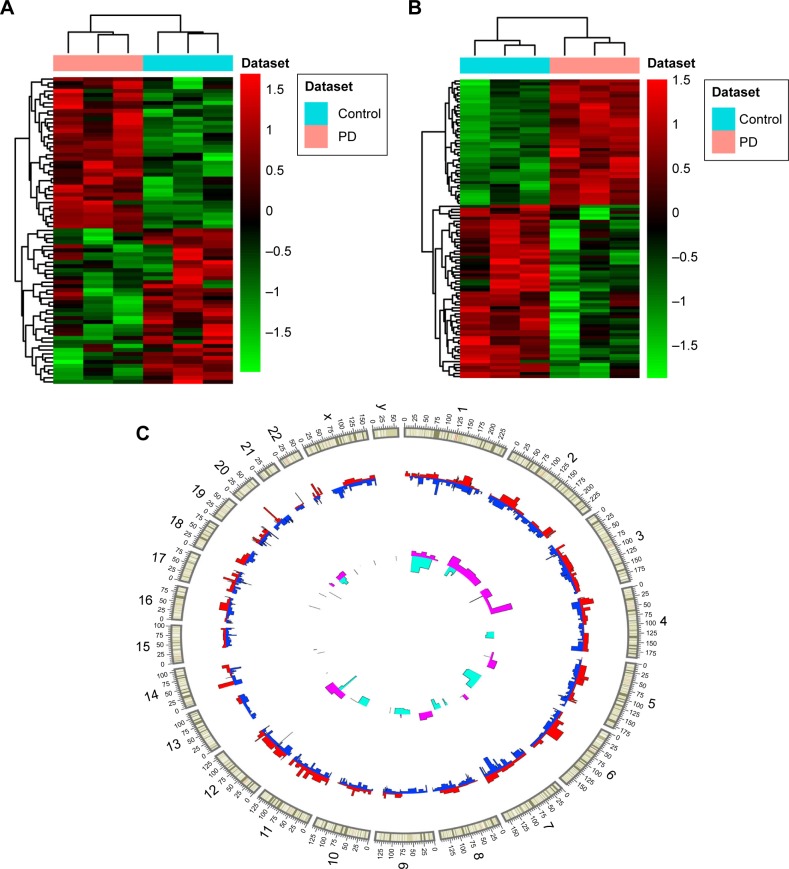
Figure 1.
DElncRNAs and DEmRNAs between PD and normal controls.
Notes: (A, B) Hierarchical clustering results of DElncRNAs and top 100 DEmRNAs between PD and normal controls, respectively. Row and column represent DElncRNAs/DEmRNAs and tissue samples, respectively. The color scale represents the expression levels. (C) Distribution of DElncRNAs and DEmRNAs on chromosomes. The outer layer cycle was the chromosome map of the human genome hg19 (GRCh37). The red and blue inner layer represents the distribution of up- and downregulated DEmRNAs on different chromosomes, respectively. The pink and light blue inner layer represents the distribution of up- and downregulated DElncRNAs on different chromosome, respectively.
Abbreviations: DElncRNAs, differentially expressed long noncoding RNAs; DEmRNAs, differentially expressed micro RNAs; PD, Parkinson’s disease.

