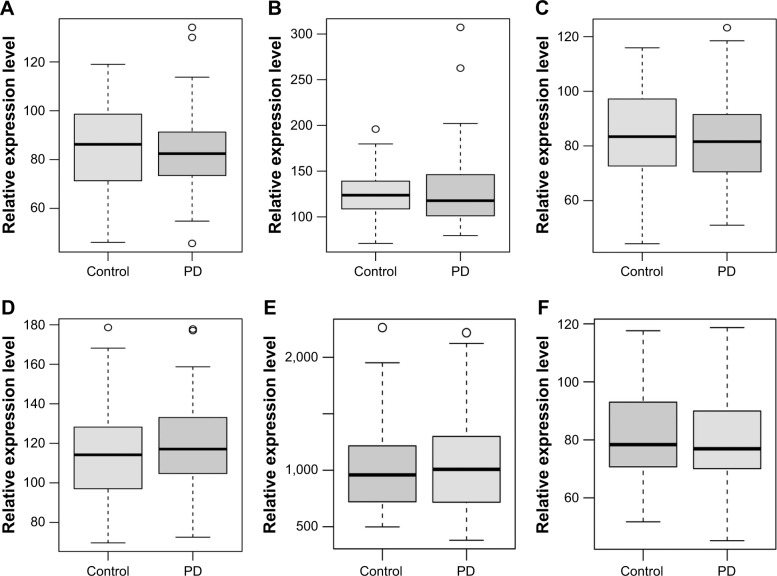
Figure 4.
Validation of selected DEmRNAs in GSE57475.
Notes: The x-axis shows PD and normal control groups and the y-axis shows relative expression levels. (A) TAL1; (B) TREML1; (C) TREML4; (D) ERBB2; (E) CX3CR1; (F) ANK1. The circles represent outliers.
Abbreviations: DEmRNAs, differentially expressed micro RNAs; PD, Parkinson’s disease.

