Figure 3.
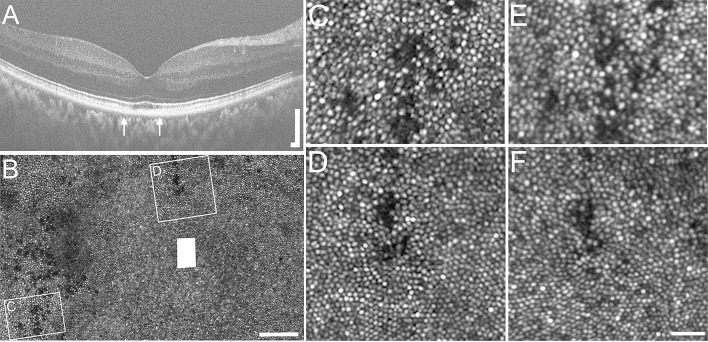
Multimodal imaging of the right eye for subject KS_0552 5 years post-trauma (A–D) and 8 years post-trauma (E,F). Macular horizontal SD-OCT line scan reveals focal foveal IZ disruption (A). Confocal AOSLO imaging of the foveal photoreceptor mosaic between the thin white arrows on (A) is shown in (B), which demonstrates multiple regions of dark, non-waveguiding photoreceptors. Two distinct regions of photoreceptor disruption (C,D) were chosen and compared with their identical regions on follow-up imaging performed 30 months after initial imaging (E,F), revealing similar structure and cone densities for both regions of interest. A: scale bar=200 µm; B: scale bar=100 µm; C–F: scale bar=25 µm. AOSLO, adaptive optics scanning light ophthalmoscopy; IZ, interdigitation zone; SD-OCT, spectral domain optical coherence tomography.

