Figure 5.

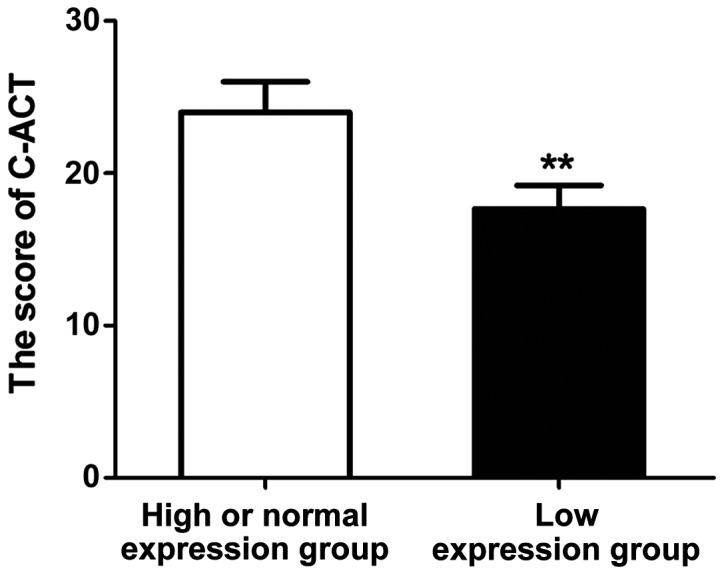
C-ACT score of patients in each group. The C-ACT score of patients in high or normal expression group is significantly higher than that of patients in low expression group (**P<0.01).

C-ACT score of patients in each group. The C-ACT score of patients in high or normal expression group is significantly higher than that of patients in low expression group (**P<0.01).