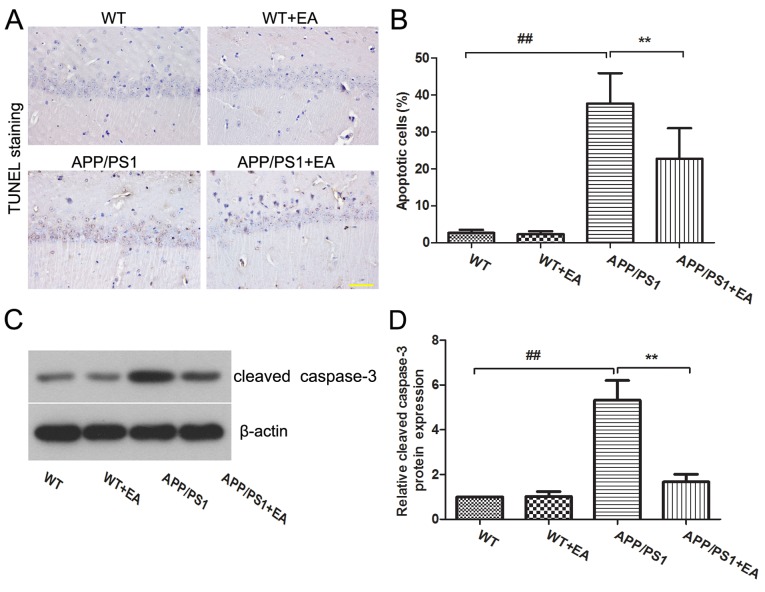
Figure 2.
Effects of EA on neuronal apoptosis in the hippocampus of APP/PS1 transgenic mice. (A) TUNEL staining of the hippocampus from WT, WT+EA, APP/PS1 and APP/PS1+EA groups. Magnification, ×400; scale bar, 50 µm. (B) Percentage of apoptotic cells in the hippocampus. (C) Western blotting and (D) quantitative analysis of cleaved caspase-3 expression in the hippocampus; β-actin served as an internal control for grayscale analysis. Data are presented as the mean ± standard deviation. ##P<0.01 vs. WT mice; **P<0.01 vs. APP/PS1 transgenic mice. TUNEL, terminal deoxynucleotidyl transferase dUTP nick end labeling; EA, ellagic acid; WT, wild-type.

