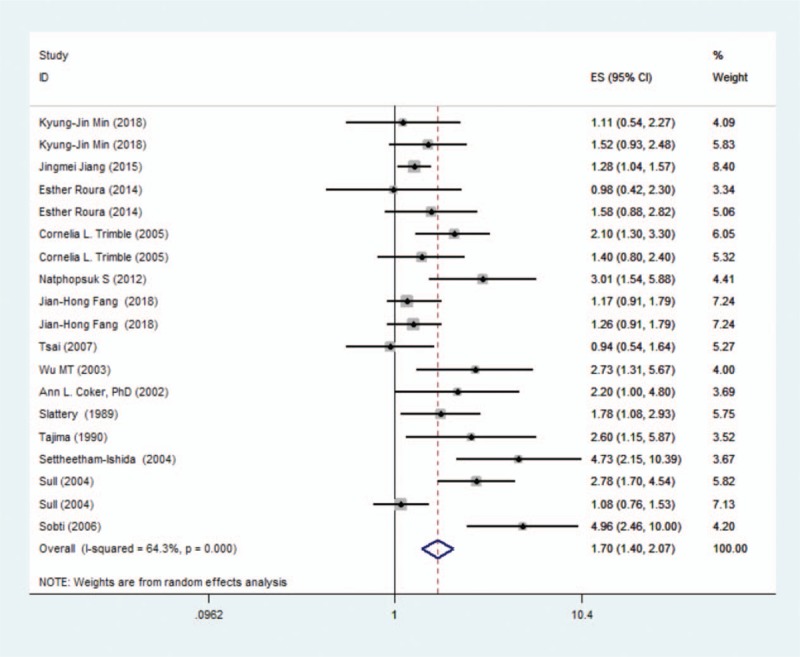
Figure 2.

Forest graph on the association of passive smoking with cervical cancer risk. The risk estimates and 95% CI from each study are shown by a square and segments, respectively. The overall summary relative risk is represented by a rhombus.

Forest graph on the association of passive smoking with cervical cancer risk. The risk estimates and 95% CI from each study are shown by a square and segments, respectively. The overall summary relative risk is represented by a rhombus.