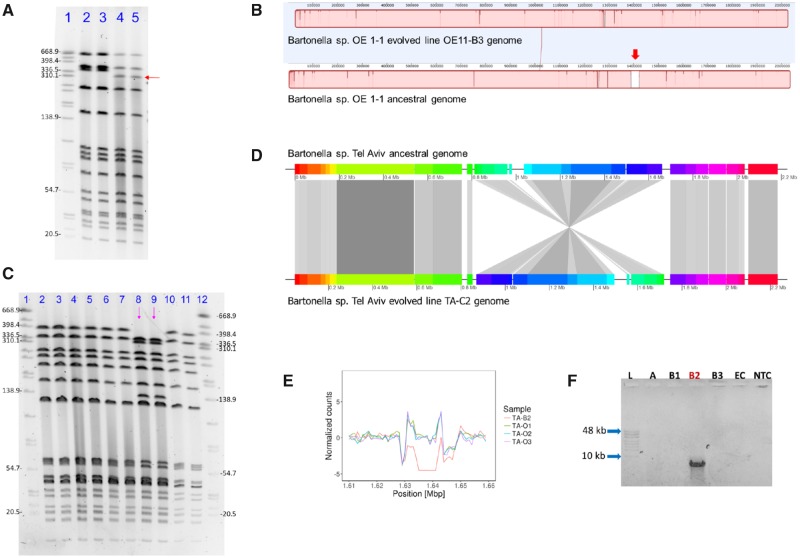
Fig. 2.
—Large structural variation events in experimentally evolved Bartonella genomes. (A) SmaI-PFGE run of Bartonella sp. OE 1-1 ancestral and evolved OE11-B3 genomes, showing a shift in the electrophoretic run of a high molecular band (red arrow), corresponding to a ∼30 kb molecular weight change in line OE11-B3. Lines corresponded to: 1. Salmonella enterica subsp. enterica serovar Braenderup (digested with XbaI, as a molecular marker); 2–3, Bartonella sp. OE 1-1 ancestral line (duplicates), and; 4–5, Bartonella sp. OE 1-1 line OE11-B3 (duplicates). (B) MAUVE alignments of whole-evolved and ancestral genomes evidencing a ∼33 kb region of the ancestral genome not covered in the evolved line (red-thick arrow). (C) SmaI-PFGE run of Bartonella sp. Tel Aviv ancestral and evolved genomes, showing a shift in the electrophoretic run of two high molecular-weight bands (∼320 and ∼130 kb) observed only in the evolved line TA-C2 (lines marked by pink arrows), and two bands (∼398 kb and ∼60 kb) which were not evident in this line, but present in the ancestors and other evolved lines. Lines corresponded to: 1&12: S. enterica subsp. enterica serovar Braenderup (digested with XbaI, as molecular marker); 2–3: Bartonella sp. Tel Aviv ancestral line; 4–5: Bartonella sp. Tel Aviv line TA-B2; 6–7: Bartonella sp. Tel Aviv line TA-C1; 8–9: Bartonella sp. Tel Aviv line TA-C2 (with a profile change: pink arrows); and, 10–11: Bartonella sp. Tel Aviv line TA-C3. (D) Whole genome comparison between ancestor and evolved lines, demonstrating a ∼800 kb inverted area in the evolved line. Figure was built using GenoplotR package in R software with the MAUVE alignment data. (E) Comparison of scaled coverage depth from Bartonella sp. Tel Aviv ancestor (triplicates) and evolved TA-B2 line in a 38,000 bp window. TA-B2 evolved line showed absence of reads covering a ∼13 kb region. (F) Conventional PCR amplification targeting the flanking sequences of the deletion detected in line TA-B2. A ∼7,000 bp product was obtained only in the TA-B2 line: L: GeneRuler High Range DNA Ladder; A: Bartonella sp. Tel Aviv ancestral strain; B1: Bartonella sp. Tel Aviv evolved TA-B1 line; B2: Bartonella sp. Tel Aviv evolved TA-B2 line; B3: Bartonella sp. Tel Aviv evolved TA-B3 line; EC: extraction control; NTC: nontemplate control. All gel pictures were color-inverted for clarity without any manipulation.

