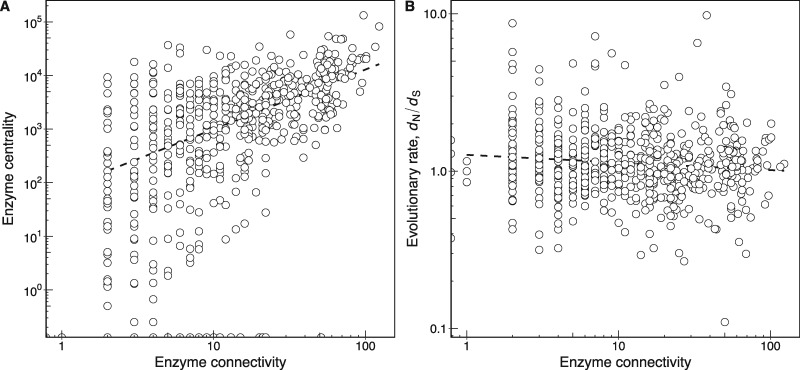
Fig. 1.
—Highly central and connected enzymes in a metabolic network do not evolve slowly. (A) The relationship between enzyme connectivity and centrality in the Escherichia coli metabolic network (Spearman’s ρ = 0.524, P < 2.2 × 10⁻¹⁶, n = 635). The centrality measure of a reaction is its betweenness centrality determined from the reaction graph (Materials and Methods). (B) The relationship between enzyme connectivity and evolutionary rate measured as dN/dS (Spearman’s ρ = −0.088, P = 0.028, n = 635). In both panels, a dashed line shows the best linear fit to the data and is provided as a visual guide. Note the double-logarithmic scale.

