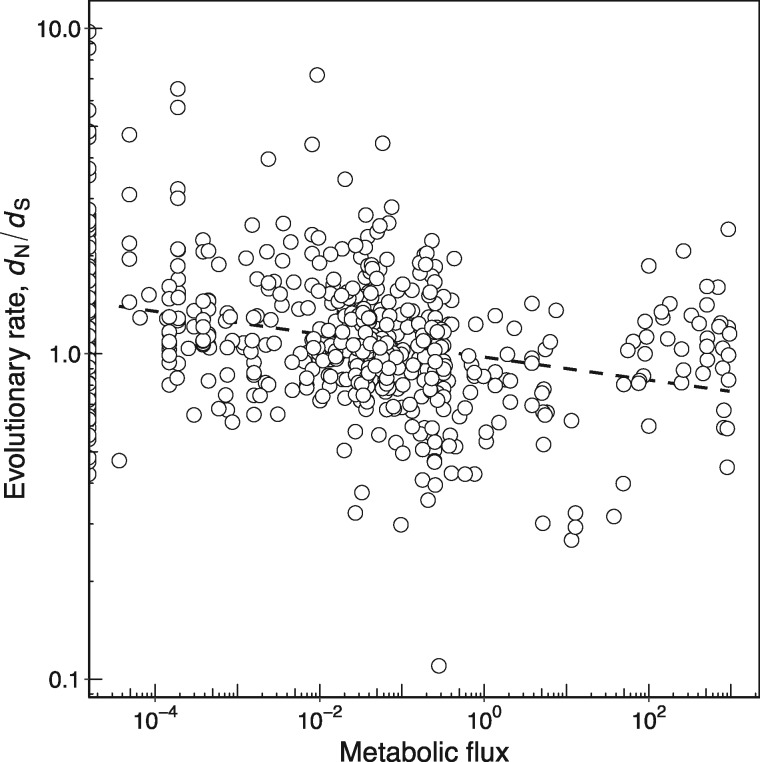
Fig. 2.
—Enzymes catalyzing reactions with high metabolic flux evolve more slowly. The relationship between metabolic flux and enzyme evolutionary rate measured as dN/dS (Spearman’s ρ = −0.299, P = 1.1 × 10⁻¹³, n = 592). The dashed line shows the best linear fit to the data and is provided as a visual guide. Flux values <10−5 are set to zero. Note the logarithmic scale on both axes.

