
Figure 4.
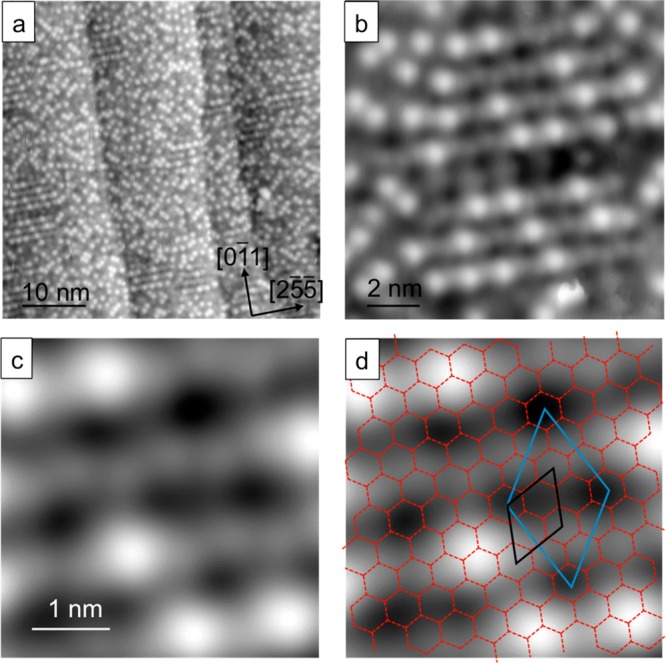
STM images showing second layer water forming a continuous 2D layer across the entire surface. (a) Large scale STM image of ∼2 ML water after annealing at 135 K. (b) Detail showing the bright features preferentially aligning orthogonal to the steps. (c) Portion of the surface with fewer bright features where the second layer water network is visible. (d) Original (3 0, −1 1) first layer network superimposed (red hexagons shown with black unit cell), along with the (5 1, −4 1) unit cell (blue) that represents the commensurate second layer superstructure. (a) 0.1 V, 21 pA; (b–d) 0.1 V, 41 pA.